Full Report
Fit
Does not fit the framework (P4b hard fail: rising share count); contested: U1
GoDaddy is ruled out by a single mechanical gate: the deterministic feature flag share_count_trend.rising fires the framework's P4b hard-fail rule, and under the spec nothing offsets it. Confidence is low — the tally's basis is "name-mask divergence or load-bearing probability divergence exceeded 0.20", and the name-mask probe flipped a gate criterion, raising the prior_driven_risk flag. No exclusion fired, there is no China sensitivity flag, and it is not watchlist-only. One criterion — U1, the US listing — is contested.
The rest of this tab lays out the ledger honestly, including the fact that all four human jury seats voted P4b met: the gate that decides the verdict is a data-window artifact the surviving evidence disputes. That dispute cannot overturn the tally; it is recorded here and in the data gaps so the reader sees exactly how the answer was reached.
Universe and exclusions
U1 — Listing: contested. GoDaddy's Class A common trades on the New York Stock Exchange under GDDY, incorporated in Delaware [1]. Two jury seats read that as a plain US primary listing (met); two returned cannot_determine. The split is a citation-provenance problem, not a factual one: the surviving listing claim pointed at IPO-prospectus and Q1-10Q pages that do not actually carry the domicile facts, which sit on the 10-K cover. The masked seat read met. There is no dispute that GoDaddy is a Delaware-incorporated, NYSE-listed company; the only foreign angle is that roughly 32% of revenue is earned internationally, diffuse geographic exposure rather than a foreign domicile.
U2 — Scale: met. Market capitalization is about $13.56B (140.621M shares at the $96.41 close on 2026-07-27), clearing the $10B floor by roughly $3.6B — though the stock is down about 55% from its three-year high and at the June-2026 trough of $74.99 the cap was only about $10.5B, so the cushion above the floor is real but thin.
Source: market data, as reported (price and share count per the latest filings).
Exclusions — clean. None of the four disqualifiers fired, and neither did the China sensitivity flag (all not_met). GoDaddy is not an auto manufacturer — it is the largest global domain registrar, with about 81 million domains under management [2] (X1). The promotion-pattern test (X2) fails on both prongs: quantified promises were met or beaten and there is no repeated hard promise-delivery gap. No secular decline is established (X3): the unit base is eroding about 3% over two years but is fully offset by pricing, so revenue still grew 8.3%. It is the antithesis of a consensus-saturated story (X4): about 2.7x trailing sales after a 55% drawdown. And no China concentration appears in any filing (S1) — the only sensitivity is broad FX translation.
Pattern match
Of the framework's four setups, GoDaddy is closest to a de-rated quality franchise on a fear dip — a cash-generative, asset-light compounder whose earnings held while the multiple compressed. It clears that pattern's dislocation entry checks: a dated adverse event (the Q4 FY2025 print, a −14.3% single session on 8.9x normal volume), a capitulation-grade volume spike (3.25x on a 20-day basis versus the 2x reference line), and the tell-tale inverted signature — free cash flow rose 19% while forward estimates were trimmed only about 2–3% against a roughly 55% price fall. What keeps it out of that pattern is not the dislocation but the framework's own machinery: the adjusted FCF yield sits below the bar, and a deterministic share-count flag trips the P4b gate. It is emphatically not the cyclicals-at-the-bottom pattern (recurring subscription revenue, no commodity price it does not control), and not the insurance/forecasting-error pattern (there is no 1:1 guidance-cut anchor — management reaffirmed guidance). It resembles the quality-franchise dip most, yet fails that pattern's yield entry check. Framing only; the tally's verdict stands.
The pillar ledger
Source: deterministic fit tally; per-criterion arithmetic from the surviving claim ledgers cited in each section below.
Year-10 gate (P1) — met, 3-1
The trimmed-mean year-10 probability is 0.755 with a spread of 0.08; cross-family agreement is false — three seats returned met and the fourth not_met. Revenue rose in ten consecutive years ($1.848B to $4.951B) and free cash flow in ten consecutive years ($325M to $1,575M), with the revenue-decline disqualifier explicitly false. The moat is genuine: roughly 21% global domain share, about 85% customer retention [3], and capex at 0.5% of revenue — an essential, sticky, asset-light franchise. Full treatment: The Scale Leader.
Strongest counter-fact: the growth is entirely monetization, not expansion. Total customers were roughly flat (20.1M in FY2020 to 20.4M in FY2025), domains under management fell (84.4M FY2021 to about 81M FY2025), and ARPU rose about 42% — so the year-10 case rests on continued attach and pricing gains against a static-to-shrinking unit base. And the company's own 10-K warns that if user preferences "shift away from recognizing and relying on web addresses" toward AI-based tools, demand for domains — its scale moat and highest-attach product — could fall [4]. That single disclosed-but-unsized risk is what the dissenting seat weighed.
FCF consistency (P2) — met
Adjusted free cash flow rose every year with no negative episode and a strictly rising rolling five-year average ($586.1M to $680.6M to $830.8M on an SBC-adjusted basis; $528.3M to $788.2M to $1,169.7M fully adjusted). The deterministic fcf_stability feature could not produce these numbers — stock-based compensation is absent from the XBRL feed for every year FY2016–FY2025 — so the series was rebuilt by hand from the filed 10-K cash-flow statements [5] [6] [7]. Detail on the metrics tab.
Strongest counter-fact: the record is one uninterrupted expansion with no observed down-year, so the consistency is real but has never been stress-tested through a downturn; and a recurring deferred-revenue inflow of roughly $0.15–0.24B a year is customer-prepay float that would reverse if billings shrank, so the durable level assumes continued billings growth rather than a static base.
Dislocation and yield (P3a, P3b, P3c, P3d)
Event (P3a): met. An identifiable, dated adverse event exists — the Q4 FY2025 print and its roughly 6% FY2026 revenue guide triggered a −14.3% single-day drop on 8.9x normal volume — yet management framed the bookings shortfall as a deliberate go-to-market trade-off (one-year terms, smaller initial orders) rather than demand loss, and reaffirmed being ahead of its 20% North Star FCF CAGR [8]. The peak-to-trough decline is a severe −65.0% over 510 days across multiple earnings-driven legs; the stock has already retraced about +28.6% off its June-2026 low.
Capitulation (P3b): met. Volume cleared the 2x reference line comfortably — 3.25x on a 20-day basis, 8.9x on the single worst session — evidence of emotion-driven selling. This is a reference line, not a gate, and the spike concentrated at one earnings leg rather than a broad, sustained panic.
Yield vs bar (P3c): not met. The framework-adjusted FCF yield computes to 8.63%, 137 bps below the 10% moderate-class bar [9]. The unadjusted FY2025 FCF yield is 11.62% — the entire shortfall is the framework's SBC ($317.8M) and trailing-acquisition ($88.0M average) haircut, a definitional gap rather than weak headline cash generation. The three-year-average adjusted yield is 6.12% (388 bps below the bar) but sharply improving as the 2020–21 acquisition wave rolls off the trailing window. The balance sheet is moderate: net debt of $2,699.4M against $1,243.9M GAAP EBITDA (2.17x) or $1,585.9M NEBITDA (1.70x) [10] [11], so the 10% bar applies — not the 25% levered bar. Had the name qualified as fortress (8.5% bar), the 8.63% reading would have cleared by 13 bps.
Forward path (P3d): met. The trimmed-mean probability is 0.74 with a spread of 0.09. Consensus FCF grows from $1,803.6M (FY2026) to $1,954.9M (FY2027) against the depressed $13.56B cap, so the unadjusted forward yield is 13–14% and the hand-adjusted forward yield still clears 10% by FY2026 (about 10.2%). Full treatment on Priced for the Fade.
Strongest counter-fact (this claim was weakened by a skeptic): the adjusted forward margin is thin and rests on GoDaddy keeping M and A near its recent zero. It spent $365–425M a year on acquisitions in 2020–21 before pausing; if acquisition spend reverts to that cadence, the FY2026 adjusted forward yield falls to about 8.0%, below the bar.
Balance sheet and self-help (P4a, P4b, P4c)
Outlast (P4a): met. Aggregate principal maturities are only $24.6M (2026), $624.6M (2027) and $24.6M (2028) before a $2,210.3M refinancing wall in 2029 [12], against $1,080.9M cash [13], a $998.6M undrawn revolver in covenant compliance [14], and $1,575.5M FY2025 free cash flow. Counter-fact: cumulative buybacks have driven book equity to near zero — a −$2,789.4M accumulated deficit against $215.1M GAAP equity [15] — leaving FCF durability as the only cushion and that $2.21B 2029 maturity still to refinance under covenants that restrict dividends and restricted payments.
Repurchase engine (P4b): the gate. All four jury seats and the masked seat voted met, yet the tally verdict is does_not_fit because the deterministic feature flag share_count_trend.rising fires the framework's P4b hard-fail rule (P4b hard_fail -> does_not_fit; nothing offsets it). This is the decisive result, and the strongest surviving counter-fact sits directly against it: the rising flag is produced solely by comparing FY2016 Class A shares (79,835K) with FY2025 (140,621K) — a rise that occurred entirely before the FY2022 buyback era and is consistent with the post-IPO Up-C exchange of Class B / Desert Newco LLC units into Class A (the Class B line and "Impact of DNC Restructure" appear on the equity statement) [16], not stock compensation or serial acquisitions. The spec's hard-fail requires a rising trend "driven by stock compensation or serial acquisitions"; here M and A has been zero since 2021 (no acquisition line on the cash-flow statement) and SBC of $317.8M is more than offset by executed repurchases of $1,601.9M in FY2025 [17]. The diluted count declines across every window since FY2022 (151.5M to 145.3M to 140.6M over FY2023–25), on top of an April-2025 authorization of a further $3.0 billion through 2027 [18]. The tally applies the flag as written; the dispute is recorded in the data gaps below. Detail on Priced for the Fade. Counter-fact the other way: Q1 FY2026 repurchases slowed to about $280M, below FCF, as the stock halved, so the pace is pro-cyclical.
Dividend cover (P4c): not applicable. GoDaddy has never paid a common dividend — no dividend line appears on the cash-flow statement, the yield is 0% against the roughly 4% materiality line, and covenants restrict dividends. (A spurious FY2016 $18.8M feed entry does not reflect an actual payment.)
Diagnosis (P5) — met, and favourable
The independent trial ruled the impairment more likely temporary than permanent: P(temporary) = 0.68 (mean 0.683, spread 0.09, per-judge 0.68 / 0.64 / 0.73), not contested, and order-stable (temporary-first 0.68 versus permanent-first 0.685, gap 0.005). The earnings anchor never fell — full-year 2025 free cash flow grew 19.0% to $1,613.6M, Q1 FY2026 revenue rose 6.1% with free cash flow up 15.1% [19], and management reaffirmed FY2026 revenue guidance of $5.195–$5.275B [20]. At $96.41 the market caps GoDaddy at its zero-growth perpetuity value (FCF $1,575.5M / 0.10, less about $2.6B net debt, is roughly $13.2B equity, within about 3% of the $13.56B cap), so if the fade is permanent the damage is fully earned — yet if growth merely continues at a conservative 4% the equity is worth about $24.7B ($175.7 per share), leaving the price about 45% below NPV. Both sides are laid out on Priced for the Fade.
Strongest counter-fact: the permanent read has real support — the same forward consensus of about 6% growth embeds continued deceleration from 8.3% in FY2025, and the 10-K warns that widespread acceptance of mobile apps or AI-powered tools "could eliminate the need to register a domain name" [21], attacking the 94%-attach front door with no new-logo growth to fall back on, while the offsetting Airo/ANS AI monetization is still pre-revenue [22].
Instrument context (I1) — not verifiable
The tally records I1 as not_verifiable. Listed LEAPS out to January 2028 (about 30 months) exist, and a 30-day implied volatility of 63.84% as of 2026-07-27 sits in the elevated 60–70 band, but both were read from third-party sources (AlphaQuery) and the chain-level open interest and bid/ask spreads could not be pulled from a machine-readable citable source — Barchart, Market Chameleon and OptionCharts all bot-wall automated access. This criterion never blocks the pillar verdicts, and here it is moot: the P4b gate already decides the fit.
What a 3x-in-3-years would require
The tally did not compute a re-rating price: "Re-rating math unavailable because the applicable bar or normalized adjusted FCF is missing." The balance-sheet-scaled bar resolved to moderate (10%), but the framework-adjusted, normalized FCF is not_computable in the feature file — stock-based compensation is missing across FY2016–FY2025 — so there is no adjusted-yield anchor to invert into a target price.
What can be said, as framework arithmetic rather than a target: at $96.41 the price already sits at the zero-growth perpetuity value (about $13.2B equity), and a conservative 4% perpetuity implies about $24.7B ($175.7 per share) — roughly 45% above the price, well short of a 3x. A 3x re-rating (about $289 per share, roughly $40B of equity) would require normalized adjusted FCF materially above today's roughly $1.17B fully-adjusted figure and a multiple expansion the current consensus does not underwrite. The base-rate context from the Clock pillar is mixed: GoDaddy's prior roughly −50% drawdown in 2018–2020 fully recovered and the stock went on to more than double to $214, but the current −65% fall is the deepest in its listed history and has not yet round-tripped. None of this is a recommendation; the gate has already ruled the name out.
Contested and undetermined
One criterion is contested: U1 (US listing), with votes met / met / cannot_determine / cannot_determine and a masked verdict of met. Both readings: family A read a genuine Delaware-incorporated NYSE primary listing (met); family B returned cannot_determine because the surviving listing claim's cited pages (the IPO prospectus and the Q1 FY2025 10-Q) do not contain the listing and domicile facts — the actual support sits on the FY2025 10-K cover page. This is a disagreement about citation provenance, not about where GoDaddy lists. Nothing was marked cannot-determine at the criterion level: every pillar reached a verdict.
Provenance
Source: fit tally provenance block and the adversarial trial tally.
Two families of models voted, and on the human-judged criteria they largely agreed — including a unanimous met on P4b, the very criterion whose deterministic flag decides the verdict. Confidence is nonetheless low, and honestly so: the name-mask probe flipped the U1 gate criterion to met, which the framework treats as evidence that priors, not pure evidence, may be doing some of the work — hence the prior_driven_risk flag. One skeptic check was refuted (the U1 listing citation) and one weakened (the P3d forward-yield path, conditional on M and A staying near zero).
Falsifier ledger
These are the standing what-would-change-this conditions carried from the jury and the diagnosis trial's flip-conditions. They are redundant by design — harvested independently from multiple seats — and reproduced verbatim so each threshold, direction, and window stands on its own:
Data gaps
The run could not answer several things, and the verdict is stated with them in view. The largest is the one under the gate itself: the P4b hard-fail flag is produced only by comparing FY2016 Class A shares (79,835K) with FY2025 (140,621K) — a pre-2021 Up-C/DNC conversion, not stock compensation or serial acquisitions — so the mechanism the spec requires for a hard fail is disputed, but the deterministic flag was honored as written. Separately, stock-based compensation is absent from the cash-flow feed for every year FY2016–FY2025 and net cash/debt is missing for FY2025, so adjusted FCF, adjusted-FCF yield and balance-sheet class are all not_computable and were rebuilt by hand from filed 10-K statements. No dollar-sized TAM for the broader SME presence/commerce market was found, so year-10 ARPU-led headroom cannot be bounded. The AI-agent demand-shift risk that would make the fade permanent is disclosed but unsized in the filings, and the offsetting Airo/ANS monetization is pre-revenue, so the temporary-versus-permanent split rests on judgment rather than a computable figure. China-specific revenue is not disclosed (the S1 "no China dependence" conclusion rests on the absence of any China concentration). Estimate momentum reaches back only 180 days, so the full peak-to-trough consensus move could not be snapshotted. And I1 option-chain liquidity could not be pulled from a citable machine-readable source.
Checked and unremarkable
Governance (people and governance scout): routine. Governance is conventional: 8 of 9 directors independent under a separate independent chair, no related-party transactions since Jan 1, 2025, single-class stock with no control person (index funds Vanguard 14.3% / BlackRock 10.7% top the register), and a standard STIP-on-Bookings/NEBITDA plus relative-TSR LTIP design that passed say-on-pay at 92.4% [23] [24].
Playbook version
Playbook: fcf-dislocation, version 4.
The Registrar and the Repricing
Almost every small business that goes online has to do one boring thing first: rent a name. A domain — the yourbakery.com a customer types into a browser — is registered, not owned, leased from the internet's naming system a year at a time through a middleman called a registrar. GoDaddy Inc. is the largest of those middlemen in the world. It managed roughly 81 million domain names at the end of 2025, about 21% of the roughly 387 million registered worldwide, and roughly 94% of its customers buy a domain from it [1]. Around that front door it sells the rest of what a one-person business needs to exist online — website building, hosting, email, security, payments and commerce tools — to about 20.4 million customers, 9.8 million of them outside the United States [2].
That business is not, on its own, why GoDaddy is interesting today. It is interesting because of a contradiction that sits on the surface of the numbers. GoDaddy earns the fattest cash margins of any listed company in its competitive set, converts a third of every revenue dollar into free cash, and buys back its own stock aggressively — and yet, of that same peer group, its shares have fallen the furthest from their high. This report reads that contradiction as one situation: GoDaddy is the scale-leader domain registrar and small-business web-presence incumbent that deliberately stopped chasing customers and rebuilt itself into a free-cash-flow-and-buyback machine, monetizing a flat-to-shrinking base by lifting revenue per customer rather than adding logos. It now trades at the cheapest cash multiple and deepest drawdown in its peer group because the market has repriced it as a slow-grower whose front-door product, domains, sits under an AI-disintermediation question — even as every hard financial number management promised keeps landing. This chapter builds the world that claim lives in. What follows takes apart the monetization engine (Squeezing a Flat Base), the track record behind the reset (The Pivot and the Promises), the open question about domains (The Front Door and AI), and the market's price itself (Priced for the Fade).
What the company sells
GoDaddy reports in two segments, and the split tells you where the business is and where it is trying to go. Core Platform — domains plus the older hosting, security and aftermarket products — brought in $3,062.1 million in FY2025, about 62% of the $4,951.1 million total. Applications and Commerce — the higher-value website, email, marketing and payments software that sits on top of a domain — brought in $1,889.0 million, about 38% [3].
Source: FY2025 Annual Report (Form 10-K), MD&A — Results of Operations [4].
The domain is the wedge. GoDaddy offers over 460 generic top-level domains — the .com, .net, .biz endings — and 59 country codes such as .co, .ca and .in, and it runs the back-end registry for roughly 170 more [5]. Because nearly every customer starts with a name, the domain is the top of the funnel that everything else attaches to. That is the "front door" this report will keep returning to: cheap to sell, near-universal, and the entry point for the software that actually carries the margins.
Revenue (FY2025, $B)
Domains Managed (M)
Share of World Domains
Annual Customer Retention
Sources: domains and share, FY2025 10-K Item 1 [6]; revenue and retention, FY2025 10-K [7].
A fragmented market with a leader inside it
The market GoDaddy leads is, in its own description, "highly fragmented and competitive," a field where these products "continue to evolve, creating opportunity for new competitors to enter the market with point-solution products or address specific segments" [8]. There is no single dominant platform standard for putting a small business online: competition arrives at once from broad platforms that do a bit of everything, from domain-and-hosting specialists, and from single-purpose tools in payments, commerce and website building. This is not GoDaddy talking its own book. Wix, in its own annual filing, describes the same market as one where "several large service companies that primarily offer domain registration and hosting services, such as GoDaddy, provide the ability for a business owner to build a website" [9]. IONOS, the European registrar whose product mix mirrors GoDaddy's most closely, calls its market "highly fragmented from the customer's perspective" [10]. When the company, its closest structural mirror, and a direct rival all describe the same market shape independently, the fragmentation is a fact about the industry, not a claim.
Fragmentation usually means no one earns much: with hundreds of substitutes and low switching friction, price competition grinds returns down. What makes this industry unusual is that a fragmented field still carries a durable leader — and the reason is worth being precise about, because it is not the reason most technology leaders give.
The first half of the answer is where the cost base is set. A registrar does not control the wholesale price of the thing it resells. VeriSign, the registry operator for .com and .net, charges every registrar a list price of $10.26 for a .com and $11.66 for a .net, and ICANN — the body that governs the naming system — adds $0.20 per registration. VeriSign "has previously been given the right to annually increase prices" and has done so, and GoDaddy states plainly that it has "no control over ICANN, VeriSign or other domain name registries and cannot predict their future fee structures" [11]. Every registrar buys the same core input at the same regulated price and passes increases through. Nobody wins the domain business on the cost of a .com.
The second half is retention, and it is where scale becomes durable. GoDaddy's annual customer retention rate was approximately 85% in four of the five years to 2025 (84% in 2024, on divestitures), more than 89% of its revenue came from customers who were also customers the year before, and customers of three years or more retained at roughly 90% [12]. Looked at as a cohort, the group of customers acquired in 2017 was still returning more than 91 cents of revenue on the dollar seven years later [13]. IONOS explains the mechanism from the customer's side: an SME is "rather unlikely" to drop its website for cost reasons or to shop around to switch providers, and instead "prioritize[s] the reliability and stability of their existing website over potential cost savings" [14]. The site a business already depends on is a small line in its budget and a large risk to move; so it stays.
That is the moat, and it is worth naming for what it is not. It is not a network effect — GoDaddy's customers do not become more valuable to each other as more join. It is not contractual lock-in. It is stickiness: low churn on a recurring, upfront-billed subscription base, which lets the leader hold the largest book of these sticky relationships and keep selling into it. Management frames the durability historically — on its most recent call the CEO noted GoDaddy has stayed "the world's largest domain registrar by far" across "30 years" of "low-priced registrars, loss-leader strategies, free domains and disruptive technologies" [15]. Execution and a big installed base, not exclusivity, are what a fragmented market rewards here.
The paradox that makes it a question today
Against the four peers in its comparison set for which full financials are available, the shape of the situation appears at once. It earns the highest operating margin in the group — 22.8% in FY2025 against a peer median of 8.2%, a gap of about 1,457 basis points — and the highest free-cash-flow margin, 31.8% against a 21.1% median. On both measures of turning revenue into profit and cash, it is the best in the room.
Source: FY2025 results as reported — GoDaddy 10-K [16]; peer figures from Wix, IONOS, Shopify and Cloudflare FY2025 filings; drawdown as of 2026-07-27.
The same table carries the other half. GoDaddy's revenue grew 8.3% in FY2025, the slowest in the set and roughly a third of the 21.5% peer median; Shopify and Cloudflare each grew near 30%. And its shares had fallen 55.0% from their three-year high as of late July 2026 — the deepest decline in the group, against a 25.7% median, with only Wix down more. A visitor to this scoreboard would find the most profitable, most cash-generative name also the cheapest on cash flow (an 11.6% trailing free-cash-flow yield versus a 4.0% peer median) and the most punished by the market.
Source: FY2025 revenue growth and FCF margin as reported; market capitalization as of 2026-07-27 [17].
A caution on the scoreboard is due, because the comparison is only as good as the companies in it. Wix and IONOS run genuinely the same model — domains, hosting and a website builder sold to small businesses — and IONOS is the closest structural mirror GoDaddy has. Shopify and Cloudflare sit in the table as larger, faster technology platforms, but they are not the same business: Shopify is a commerce platform built around merchant sales, and Cloudflare sells internet infrastructure and security to developers and enterprises. They frame the growth end of the field, not a like-for-like margin comparison. Two of the six intended peers — Tucows and BigCommerce, arguably the two closest of all — could not be loaded, so the median here is drawn from four names and understates how many small, mixed-model rivals populate this market.
What the paradox is not is a sector sell-off that caught GoDaddy along with everyone else. The peer median drawdown of 25.7% is less than half GoDaddy's 55.0%; the market repriced this company specifically. The rest of this report works through why. The engine that produces the group-leading cash comes first — how a company growing at 8% throws off the margins of one growing at 30%, and why free cash flow, not reported earnings, is its truest output. On the far side sits the reason the market discounts it anyway: the same 21% domain share that is the moat is the asset GoDaddy's own filing warns could lose demand if users reach the internet through apps and AI agents instead of typing a web address. Between the clean cash record and that open question is where a price this far below the peer group gets decided.
The Monetization Engine
A company growing revenue at 8% a year does not, as a rule, out-earn a company growing at 30%. GoDaddy does. The reason is that its growth is not the same thing as its rivals' growth. Wix, Shopify and Cloudflare grow by adding customers; GoDaddy grows by selling more to the customers it already has. In FY2025 it collected $242 of revenue per user, up from $170 five years earlier — a 42% climb — while the number of customers barely moved and the count of domains it manages actually fell [1][2]. This chapter takes the engine apart: the one number the top line leans on, where the margin actually comes from, and why the truest measure of what this business earns is the cash it throws off, not the profit it reports.
One number does most of the work
GoDaddy publishes a short list of business metrics, and read together they say something unusual: the base is not growing, and the revenue is. Average revenue per user (ARPU) — total revenue divided by the average customer count — rose from $203 in FY2023 to $220 in FY2024 to $242 in FY2025, a 19% gain in two years [3]. Over the same two years total customers slipped from 21.0 million to 20.4 million, and domains under management fell from 83.6 million to 80.8 million [4]. Over five years the divergence is starker still.
Source: derived from reported business metrics — FY2025 10-K [5] and FY2022 10-K [6]; ARPU, total customers and domains under management indexed to FY2020.
Over five years ARPU rose 42% while the customer count moved less than two points and domains under management drifted down. GoDaddy tells investors as much in its own definitions: ARPU "provides insight into our ability to sell additional products to our customers," while the customer count is only something that "can be a contributing factor to our ability to increase our revenue base" [7]. One metric is described as the lever; the other is described as, at best, a helper. Revenue growth here is attach and price on a fixed set of accounts — selling a second and third product into a base held together by the low churn established earlier in this report (World's #1, Priced to Fade) — not accounts won.
The domain leg makes the point in miniature. Domain revenue rose from about $1.8 billion in FY2021 to $2,310.5 million in FY2025 — up roughly 27% — while the domain unit count fell about 4% over the same span [8]. A bigger revenue line on fewer units is, by arithmetic, price and aftermarket demand — GoDaddy sells second-hand domains on a gross basis through its aftermarket — rather than volume. The clearest statement of the model is that its largest single product category grew a quarter while the thing it counts shrank.
ARPU (FY2025)
Total Customers (M)
Domains Managed (M)
Source: FY2025 Annual Report (Form 10-K), Business Metrics [9].
Where the margin comes from
If ARPU explains the top line, segment mix explains the margin. GoDaddy reports in two segments, and they earn very differently. Applications and Commerce — the website, email, marketing and payments software that sits on top of a domain — carried a 45.4% segment EBITDA margin in FY2025 and grew 14.3% [10]. Core — domains plus the older hosting, security and aftermarket products — carried a 33.0% segment EBITDA margin and grew 4.9% [11]. The faster segment is also the fatter one, so as its share of revenue rises, the blended margin rises with it — mechanically, before any cost is cut.
Source: FY2025 Annual Report (Form 10-K), Segment Results of Operations [12][13].
That shift has been steady. Applications and Commerce grew from about 28% of revenue in FY2020 to 38.2% in FY2025, its segment margin widening from roughly 40% to 45.4% while Core's climbed from the mid-20s to 33.0% [14]. The two forces compound: a larger slice of the business is the higher-margin slice, and each slice is itself getting more profitable. Consolidated operating margin roughly doubled over the period, from 10.0% in FY2021 to 22.8% in FY2025 [15].
Within Core, the split matters for what comes later in the report. Domains grew 7.3% to $2,310.5 million, but "Core platform: other" — the legacy hosting and aftermarket line — shrank to $751.6 million from $805.2 million two years earlier [16]. Growth is concentrating in the commerce software and the domain front door; the oldest products are in slow decline. Where that leaves GoDaddy against Shopify and Wix on the commerce side is a later question (The Front Door and AI); here the point is only that the mix has been moving GoDaddy toward its best economics.
The margin gap, and where it does not come from
The result of all this is the anomaly that opens the report from the cost side: in FY2025 GoDaddy's operating margin of 22.8% ran 1,457 basis points above the 8.2% median of its peer set [17]. The instinct is to reach for gross margin — the classic explanation for why one software company out-earns another. That instinct is wrong here, and the way it is wrong is the whole point.
GoDaddy's gross margin is about 64%: cost of revenue, which excludes depreciation, was $1,801.5 million on $4,951.1 million of revenue [18]. That is squarely in the middle of the peer group — below Wix at 68% and Cloudflare at 74%, above Shopify at 48%. Cloudflare keeps eleven more points of every revenue dollar at the gross line than GoDaddy does, and still posts a negative operating margin. So the gap opens below the gross line.
Source: GoDaddy gross margin derived from cost of revenue, FY2025 10-K [19]; operating margins as reported [20]; peer figures from Wix, IONOS, Shopify and Cloudflare FY2025 filings, as reported.
The chart tells the story in one look. Gross margins across the group sit in a fairly tight band; operating margins fan out from Cloudflare's −9.6% to GoDaddy's 22.8% and IONOS's 27.6%. What separates the two ends is how much each company spends between gross profit and operating income — and most of that difference is the cost of chasing customers. GoDaddy spent 7.6% of revenue on marketing and advertising in FY2025 [21]; a company growing 30% by acquiring merchants and developers spends multiples of that on sales and marketing to do it. The two names at the top of the operating-margin ladder, GoDaddy and IONOS, are precisely the two that grew slowest — the incumbents monetizing an installed base rather than buying a new one. The peer-median margin of 8.2% is not a group of inferior operators; it is a group that has chosen to convert its gross profit into growth. GoDaddy has chosen to convert its gross profit into operating income. The 1,457-basis-point gap is that choice, measured.
That framing sets up the tension the rest of the report inherits: the same discipline that produces the group's best margin is inseparable from the slowest growth in the group. Whether that is prudence or a ceiling — whether a base that is flat by choice can keep yielding more per user indefinitely — is taken up where the growth question belongs (The Front Door and AI).
From margin to cash
Operating income is where most analyses of a software company stop. For GoDaddy it undersells the model, because the business collects cash before it earns it. Customers pay up front for a year or more of a subscription, and GoDaddy recognizes that payment as revenue only as the service is delivered. It "typically collect[s] payment at the inception of a customer contract but recognize[s] revenue ratably over the term of the contract" [22]. Two figures fall out of that timing. First, bookings — the total value of contracts signed in the year — ran ahead of recognized revenue: $5,400.0 million of bookings versus $4,951.1 million of revenue in FY2025 [23]. Second, the gap between the two piles up on the balance sheet as deferred revenue: $3,319.1 million at year-end, of which $2,367.0 million of the prior year's balance was released into 2025 revenue [24].
That deferred balance is an interest-free loan from customers. It is the largest single item on GoDaddy's liability side — the $2,384.2 million current portion alone is bigger than every other current liability combined — and it is why the company runs on negative working capital: current liabilities of $2,995.5 million against current assets of $1,840.9 million [25]. A business that gets paid before it performs, carries almost no receivables — $83.1 million, about 1.7% of revenue — and holds no inventory has very little working capital to fund [26]. With near-zero capital spending — $23.9 million in FY2025, under half a percent of revenue — the reported profit converts to cash almost without leakage [27].
Source: net income and operating cash flow, FY2025 10-K Statements of Cash Flows [28]; free cash flow as reported (operating cash flow less capital expenditure).
Operating cash flow of $1,599.4 million in FY2025 came in nearly twice reported net income of $875.0 million [29]. Cash flow has run ahead of net income in four of the past five years; the exception, FY2023, is itself the tell — reported profit that year was lifted above cash flow by a large non-cash tax benefit that never touched the bank account [30]. Free cash flow reached $1.58 billion, a 31.8% free-cash-flow margin against a 22.8% operating margin — a nine-point spread that is the deferred-revenue float and the non-cash charges (depreciation, amortization and stock compensation) working in cash's favor. This is why, for GoDaddy, free cash flow is the honest measure of what the business earns and reported earnings per share is not: the profit line is thinned by non-cash charges and, as that FY2023 spike shows, whipsawed by one-off tax items that have nothing to do with the operation — a distinction the management chapter takes up directly (The Pivot and the Promises).
Two honest asterisks
The cash story is real, but it is not free of caveats, and two belong on the record here so the later chapters can weigh them.
The first is stock-based compensation. GoDaddy added back $317.8 million of equity compensation to operating cash flow in FY2025 — 6.4% of revenue, and by itself larger than all depreciation and amortization combined [31]. It is a genuine cost — it pays employees and dilutes owners — that never appears in the cash outflow. Free cash flow of $1,575.5 million therefore overstates the all-in economic cost of running the business by a real amount, and whether the buybacks that follow merely mop up that dilution or actually shrink the share count is a capital-allocation question the next chapter settles.
The second is that the float is a tailwind, not a fixed level. The $206.8 million that deferred revenue contributed to operating cash flow in FY2025 exists only because bookings grew; if net billings ever stopped rising, that contribution would flatten or reverse, and cash conversion would step back toward operating income [32]. For now bookings are still climbing — $4,603.1 million to $5,400.0 million over two years — so the float is intact, but it is a function of growth, and the engine's growth, as this chapter has shown, depends on one variable continuing to climb: revenue per user on a base that is no longer expanding [33].
The Pivot and the Promises
Squeezing a Flat Base described the machine as it runs today: one lever — ARPU on a flat customer base — feeding a capex-light, upfront-billed model that converts revenue to cash at a 31.8% margin. That machine did not assemble itself. It is the product of a single decision taken in 2019 and a run of promises management made, and mostly kept, while proving the decision worked. This act reads the record: what management said it would do, what it did, and where the two diverge.
The Free-Cash-Flow Reset
The formative decision was to stop optimizing for customers and start optimizing for cash per share. Under Aman Bhutani, chief executive since September 2019, management reframed the whole business around what it calls its "north star of maximizing free cash flow over the long-term" [1]. Everything downstream — the segment recut, the margin expansion, the buyback — is machinery in service of that one objective.
The reset shows up in the margin structure. Operating margin roughly doubled between FY2021 and FY2025, and the free-cash-flow margin climbed from just over a fifth of revenue to nearly a third — a widening gap that is the signature of a company harvesting a base rather than buying growth.
Source: operating margin and free-cash-flow margin, FY2021–FY2025, as reported; operating income per the FY2025 Consolidated Statements of Operations [2] and operating cash flow per the Consolidated Statements of Cash Flows [3].
The plumbing that turns that margin into per-share value is the 2022–2023 recut into two segments — the high-margin Applications and Commerce line and the durable Core Platform cash base introduced earlier — paired with a capital-return framework built around a multi-year share-reduction target. The segments generate the cash; the framework decides where it goes. What makes the reset legible as a track record, rather than a slogan, is that management then put numbers on it and let investors keep score.
The Said-Versus-Did Ledger
At its March 2024 investor day, management set three-year targets that are unusually specific for a company its size: 6% to 8% annual revenue growth, a normalized-EBITDA margin near 33% by 2026, more than $4.5 billion of cumulative free cash flow, and a 20%-plus compound growth rate in free cash flow per share [4]. Those targets are the yardstick. Held against them, the record splits cleanly by the kind of promise.
Sources: three-year targets, 2024 Investor Day [5]; share reduction and customer-growth commitment, Q3 FY2024 call [6]; FY2026 revenue guide and deferred pricing lever, Q4 FY2025 call [7]; FY2025 customer count, FY2025 10-K [8].
The hard financial promises were kept or beaten, and they were kept through the drawdown, not before it. The share-reduction target is the clearest example: management said it would cut gross shares about 20% over three years and reported a 23% reduction by the third quarter of 2024, "three points ahead of our three-year targeted reduction of 20%" [9]. Free cash flow reached $1.58 billion in FY2025, a 19% gain [10], keeping the three-year cumulative target on a path to clear $4.5 billion with room to spare. Revenue grew 7.5% and then 8.3% — the top half of the promised band — before the FY2026 guide came in "at approximately 6% at the midpoint," the bottom of it [11].
The gaps are all on the softer, narrative side. In late 2024, with divestitures and product migrations behind it, management told investors "we expect to return to customer growth in 2025" — the count then stood at 20.7 million [12]. The FY2025 count instead came in at 20.4 million, below that starting point [13]. Rather than deliver the headline, management reframed toward "high-intent" customers and a higher-spend cohort. Whether narrowing the funnel deliberately is the right strategic call is the subject of The Front Door and AI; as a stated promise, it was abandoned, not met. Pricing and bundling — a headline growth lever through 2024 — was pushed out behind the new product: "we have pricing and bundling initiatives that are going to have to wait because this new AI-based website builder is just ready to go" [14]. The commerce and payment-volume theme that filled the 2024 script faded from later calls in the same way.
The pattern is worth stating plainly: when GoDaddy attached a number to a promise, it delivered; when the promise was a narrative — more customers, a pricing cadence, a commerce story — it was reframed as conditions changed. That distinction matters for how much weight to put on management's word going forward, and it points at the two commitments still open: the buyback and the AI bet.
The Buyback and Its Timing
GoDaddy is a single-instrument capital allocator. It pays no dividend, spends almost nothing on capex, and has done no material acquisitions since the Host Europe era; nearly all of its cash goes to one place. Across FY2021–FY2025 the company generated about $5.5 billion of free cash flow and spent about $5.4 billion buying back stock — roughly 97 cents of every free-cash dollar — which the May 2026 investor deck frames as returning more than 95% of free cash flow to repurchases, some $5.1 billion cumulatively, for a 31% cut in gross fully diluted shares since January 2022 [15].
Buybacks, FY2021–FY2025 ($B)
Share of FCF Returned
Gross Share Cut, Jan 2022–Q3 2024
Source: buyback and free-cash-flow totals derived from reported cash-flow statements, FY2021–FY2025; gross-reduction figure per the Q3 FY2024 call [16] and 2026 overview deck [17].
The gross-reduction headline overstates the net economic return, which resolves a thread Squeezing a Flat Base left open. Equity-based compensation runs near $300 million a year — $317.8 million in FY2025, larger than all depreciation and amortization combined [18] — and that stock is re-issued to employees each year. So despite $1.3 billion to $1.6 billion of gross repurchases annually, the diluted share count fell only about 3% to 4% a year, from 151.5 million in FY2023 to 140.6 million in FY2025. The buyback is roughly one-fifth a dilution offset and four-fifths genuine shrink; the net accretion is real, but more modest than the gross number suggests.
The softer part of the record is not whether management returned the cash — it plainly did — but the price it paid. The average price of open-market repurchases rose every year, from about $73 a share in 2023 to roughly $125 in 2024 and $142 in 2025 [19], with accelerated repurchase agreements settled at higher marks still — $139.65 in 2024 and $176.02 in 2025 [20].
Source: average price derived from reported open-market repurchase dollars and share counts — FY2023–FY2025 per the FY2025 10-K repurchase table [21]; FY2022 per the FY2024 10-K [22].
The largest dollar year was the last and the most expensive. At about $96 a share on July 27, 2026 — down 55% from its early-2025 high — the entire 2025 program sits underwater, and the 2025 accelerated repurchase at $176 deeply so. Then the pattern inverted: in the first quarter of 2026, with the stock roughly halved and cash at $1.3 billion, GoDaddy bought back just 3 million shares for $280 million against $474 million of free cash flow [23] — spending less as the stock got cheaper, not more. Asked about it directly, management deflected to the long view: "don't look at any particular quarter; look at our history — it's a good indicator of how we approach this" [24]. The commitment to return capital has held for five years; the price discipline is the part of the record still under scrutiny.
Reading Earnings Through the Tax Line
There is one place where the reported numbers can mislead a reader who stops at the bottom line, and it is worth clearing before the valuation chapter. Diluted earnings per share fell from $9.08 in FY2023 to $6.45 in FY2024 to $6.22 in FY2025 [25]. Read alone, that looks like a business going backwards. It is the opposite.
Source: FY2025 Consolidated Statements of Operations [26] and Consolidated Statements of Cash Flows [27].
Operating income rose every year, from $547.4 million to $1,127.3 million, and operating cash flow climbed from $1,047.6 million to $1,599.4 million over the same span. Net income fell only because the tax line reversed. FY2023 net income of $1,375.6 million carried a $971.8 million income-tax benefit, driven by releasing most of the U.S. deferred-tax-asset valuation allowance; FY2024 carried a $171.5 million benefit, itself driven by a $267.4 million gain from the DNC (Desert Newco) restructure; FY2025 normalized to a $145.0 million tax expense [28]. GAAP earnings fell because two one-off tax tailwinds ran out, not because operations weakened. Across these three years the comparable series are operating income and cash, not net income or EPS — which is why the two FY2025 quarters that screened as earnings "misses" have to be read against the tax base effect, and why the market's growth-line concern, examined in Priced for the Fade, is a separate matter from earnings quality.
One caveat belongs on the same page. The largest of those estimates — the FY2023 valuation-allowance release — was booked in the very year GoDaddy disclosed a material weakness in the design of its controls over income taxes; management concluded its internal control over financial reporting was not effective as of December 31, 2023. The weakness has since been remediated, and controls were attested effective at year-end 2024 and 2025 [29]. Ernst and Young has audited the company since 2004 and issued a clean opinion, its sole critical audit matter the mechanical complexity of high-volume subscription billing rather than any judgment or estimate [30]. The control gap sat precisely on the account that produced the biggest one-off — a specific reason to lean on cash generation over reported earnings, which this model already invites a reader to do.
Oversight and Incentives
The governance backdrop is conventional and carries no red flag; it sits here as the frame around the delivery record rather than a finding of its own. The board runs under a separate independent chair, Brian Sharples, with the CEO the only member drawn from management [31]. Ownership is fully dispersed: there is no founder, sponsor, or control person, index managers Vanguard (14.3%) and BlackRock (10.7%) top the register, and the entire board-and-management group holds under 1% of the economics [32].
The one detail that reinforces the read-earnings-through-management theme is in the pay design. For FY2025 the annual bonus formula was narrowed from four corporate metrics to two — Normalized EBITDA and Bookings, weighted equally — dropping revenue and unlevered free cash flow [33]. Both surviving metrics are company-defined, non-GAAP measures that management itself sets and reconciles; the change removed the two GAAP- and cash-anchored checks from the bonus. Pay is large and equity-heavy — the CEO earned $23.0 million for 2025, 95% of it stock and none of it options [34] — and the say-on-pay vote passed with 92.4% support, solid but with a non-trivial 7.6% against [35]. None of this is a problem. It is worth knowing that the yardsticks management is paid against are ones it defines — the same reason the tax line above rewards a reader who checks the cash.
Where the Record Stands
Across an eighteen-month, 55% decline, GoDaddy met or beat every quantified financial target it set. Free cash flow, margin, and the roughly 20% share-reduction promise were all delivered or exceeded, and they were delivered while the stock fell, not before. On the evidence, this is a de-rating against a clean delivery record, not a company that missed its numbers.
The strongest fact against leaning on that record is that the promises which slipped are the growth-side ones — the return to customer growth, the pricing cadence, the commerce story — and the two live commitments now pull in opposite directions. The buyback, the more reliable of the two for five years, just slowed as the stock cheapened and cash built; the AI revenue bet that would justify retaining that cash is one management still declines to size. A reader would revise the "clean deliverer" read if the bookings line failed to recover through FY2026, or if cash conversion stopped running ahead of reported earnings — either would turn a multiple de-rating into the early signal of a delivery problem.
That leaves two questions the record cannot settle on its own. Whether the growth story the cash rests on survives the shift toward AI-driven discovery is taken up in The Front Door and AI. Whether the price the market now sets fairly reflects a clean deliverer that stopped growing is the subject of Priced for the Fade.
The Front Door and AI
Every dollar of the cash machine the last act described rests on one prior condition: that people keep buying, keeping, and building on domain names. That is where the clean delivery record meets the one thing management cannot promise. GoDaddy's scale in domains — roughly 21% of the world's registered names, the top of a funnel that 94% of its customers enter through — is both its widest moat and the single asset its own 10-K warns could lose demand if the internet stops running on web addresses [1] [2]. This chapter is about the unresolved half of the story: why the top line grows at a third of the peer pace, why that is partly a choice and partly not, and why the technology shift now reshaping the internet lands on precisely the product GoDaddy leads.
A growth deficit by design
In FY2025 GoDaddy grew revenue 8.3%. The peer median was 21.5% — Shopify at 30.1%, Cloudflare at 29.8%, Wix at 13.2%, and only IONOS, the closest structural twin, slower at 5.5%. The company sits roughly 13 percentage points below the middle of its own comparison group on the one metric the market watches first.
Source: peer comparison, FY2025, as reported in company filings and consensus data; GoDaddy 8.3% per FY2025 10-K [3].
Most of that gap is deliberate. The engine described earlier runs on ARPU, not units — Squeezing a Flat Base showed revenue per customer rising 42% over five years while the customer count and domains under management both slipped. A business built to lift spend on a base it is not trying to enlarge will, by construction, grow slower than one still adding logos. Management has made the trade explicit. Asked on the Q1 FY2026 call whether it would defend domain market share, the CEO answered that "we will let lower-LTV customers go because our focus is on high-intent customers," framing three decades of surviving "low-priced registrars, loss-leader strategies, free domains and disruptive technologies" as a bet that the value sits with "someone who buys a domain and then uses other products" [4]. Against the peer chart, the growth deficit is the visible cost of a strategy that prices lifetime value over volume.
Not all of it is choice, and the honest version says so. FY2026 revenue is guided to roughly 6% at the midpoint — the bottom of the 6–8% band management set at its 2024 Investor Day — after a cut of just over 200 basis points that the company attributes to the expiration of the .CO registry contract, the exclusion of high-value aftermarket transactions, and a go-to-market change that shifted new domain buyers toward shorter one-year terms [5]. Consensus sits near the same level, at 5.9% for FY2026.
Source: FY2021–FY2025 revenue as reported; FY2026E is management's ~6% midpoint guide, Q4 FY2025 call [6], close to the 5.9% consensus.
That is the working behind the anomaly. Eight percent growth is not a broken franchise; on a monetize-the-base model it is roughly what the design produces, and the FY2026 step-down is mostly one-time registry and mix effects that management named in advance. But the deceleration removes the cushion that unit growth once provided. With the customer and domain base flat to shrinking, every future dollar has to come from ARPU and attach — which puts the whole top line on the durability of one asset, and on whether that asset survives the shift now underway in how people find things online.
Where the threat lands
GoDaddy's FY2025 10-K carries a risk factor that reads differently from the usual boilerplate, because it aims at the core product rather than the periphery. The filing warns that "if internet users' preferences or practices shift away from recognizing and relying on web addresses or they were to significantly decrease their use of web browsers in favor of apps or AI-based tools to locate and access content, demand for domain names … could be negatively affected" — and, one clause earlier, that the market could see "the creation and institution of alternate systems for directing internet traffic without using the existing domain name registration system" [7].
The reason this matters more for GoDaddy than for a diversified software peer is positional. Domains are the leg where the company is the acknowledged global leader and the entry point that feeds every higher-margin product behind it. The same scale that World's #1, Priced to Fade established as the moat is the surface the AI-agent shift would erode first. If discovery moves to assistants and agents that resolve intent without a human ever typing or clicking a web address, the front door narrows — and it narrows on exactly the product that carries GoDaddy's 94% attach rate and seeds the rest of the funnel.
Management does not deny the pressure so much as bound it. Pressed on the Q4 FY2025 call about whether the go-to-market change was forced by shifting traffic, the CEO said plainly that "the world is changing very, very quickly, and I don't think anyone is insulated from it," then argued that GoDaddy's funnel stays healthy because "a lot of companies are facing challenges of traffic from search" while GoDaddy can "go into other channels to drive traffic" and "constantly … improve conversion" [8]. That is a testable claim about traffic and conversion offsetting a demand-side headwind, not a dismissal of it. What the corpus cannot supply is a number: nowhere in the filings is there an estimate of how much of the ~85% retention or 94% attach would be exposed under an agent-led shift, or on what timeline. The risk is described in direction only, and it is genuinely open — the load-bearing uncertainty this chapter exists to surface.
The battleground moves to contested ground
While domains sit under the AI question, growth inside the business is migrating toward a leg that is contested by larger rivals. In FY2025 the Applications and Commerce segment grew 14.3% to $1,889.0 million while the Core Platform segment — domains and legacy hosting — grew 4.9% to $3,062.1 million [9]. The mix is shifting, as the monetization chapter detailed, toward commerce and presence software — and that is where GoDaddy meets competitors operating at a scale it does not approach. Shopify's platform facilitated $378.4 billion of gross merchandise volume in 2025, up 29% [10]. GoDaddy leads the domains leg it is de-emphasizing and competes from behind in the commerce leg it is leaning into.
The competitive field remains fragmented — GoDaddy's own filing calls it "highly fragmented and competitive," and no single rival dominates [11]. But the same technology shift shows up on this front too, as a demand-side pressure the whole peer group names independently. Wix's FY2025 20-F, the one peer filing that mentions GoDaddy by name, places it among "several large service companies that primarily offer domain registration and hosting services" that also let owners build sites, and in the same breath flags "the emergence of generative AI website builders" as an overlapping competitive threat [12]. GoDaddy's filing lists the same force. So the pressure is two-sided: AI agents threatening the domain front door, and generative AI compressing the value of the website-building bundle that sits behind it — the latter shared across the peer set, the former landing hardest on the one product GoDaddy leads.
The response: naming the agents
GoDaddy's answer is to try to turn the threat into a market it could lead, using the one asset the shift would otherwise strand: its registrar role. The company has built the Agent Name Service (ANS), described in the 10-K as "an open architecture built on industry standards to serve as a trust layer for AI-powered agents," in production with registered agents operational since the end of 2025, developers registering through a public API and a globally accessible Transparency Log [13]. The logic is that if AI agents need to discover one another, verify identity, and establish trust, they will need a naming and directory layer — and GoDaddy already runs the retail scale in the internet's existing naming system. As the CEO put it, "As the world's largest domain registrar, this role aligns with our core strengths" [14]. ANS anchors agent identity to the domain name system itself, and a first enterprise integration with MuleSoft, a Salesforce company, launched in early 2026 [15].
Alongside it sits Airo AI Builder, the generative product that lets a user "describe your idea" and get a live website, which the company says reached a "$10M+ annualized bookings run rate within weeks" of launch [16]. Both are real, shipping products with early adoption. Neither is yet a business a reader can underwrite.
On ANS, management says the service "has the potential to create monetization similar to domain registration" — a statement of intent, not a revenue line; it remains pre-revenue. On Airo AI Builder, the CEO calls the $10 million figure "annualized bookings," adds that "this is very early data," and declines to size where it could go because it is "super early." As of the latest filing, neither the agentic-naming market nor the AI-builder attach has a disclosed unit economics or contribution.
Sources: ANS monetization framing and MuleSoft integration, Q4 FY2025 call [17]; Airo AI Builder early data and sizing, Q1 FY2026 call [18]; ANS in production, FY2025 10-K [19].
The response deserves neither dismissal nor credit for revenue it does not yet earn. GoDaddy is doing the strategically coherent thing — extending its identity-and-naming role from web addresses to AI agents, funded from a cash engine that costs it nothing to run the experiment. But an unsized run-rate and a pre-revenue trust layer are a plan, not a result. The company that reliably converts promises into cash, as The Pivot and the Promises documented, is asking to be believed on the one line it has not yet delivered.
What has to stay true
The monetization engine keeps compounding only if a specific chain holds. ARPU and attach have to keep rising on a customer and domain base that no longer grows in units. Domains have to remain the discovery front door long enough for that to matter — meaning either the shift to apps and AI agents arrives slowly, or ANS and Airo convert the threat into a new line before it bites the old one. And the contested commerce leg the mix is moving into has to hold its own against rivals with far larger scale. None of these is failing today; the cash record proves the model still works on the base it has. What the corpus cannot resolve is whether the base itself stays intact as discovery moves off the web address — the question the filing raises and cannot answer, and the reason a company delivering its every financial promise trades where it does. That price, and what it implies about which way this resolves, is where the report turns next.
Priced for the Fade
Everything the earlier acts established — the sticky registrar franchise (World's #1, Priced to Fade), the monetization engine that turns a flat base into 31.8% free-cash-flow margins (Squeezing a Flat Base), a management team that hit every hard financial number through the drawdown (The Pivot and the Promises), and the one open question of whether domains stay the discovery front door (The Front Door and AI) — meets its price here. GoDaddy closed 2026-07-27 at $96.41, a market capitalization of $13.56 billion. That is 55% below its trailing three-year high — the deepest drawdown in its peer set — sitting on the group's best margins and cheapest cash multiple. This chapter reads that price as arithmetic: what it discounts, what it implies for a buyer's return, and the dated tests that will settle which way it resolves.
The round trip
The starting point is how recent, and how large, the repricing is. From a trough near $70 in August 2023, GoDaddy ran roughly 3x to a peak of $214.35 on 2025-01-28 — a compounder's valuation, on a compounder's story. It then unwound almost all of that gain: a grinding decline through 2025 to about $124 by December, a sharp leg down to an intraday-close low of $74.99 on 2026-06-22, and a partial recovery of roughly 29% off that low to the $96.41 close.
Source: daily closing prices, as reported (month-end observations; the January-2025 peak of $214.35 and June-2026 low of $74.99 are intraday-close extremes).
The size of the fall is anomalous against the peer group, not just against GoDaddy's own past. At −55.0%, the drawdown runs 2,929 basis points wider than the −25.7% peer median. Only Wix, down 77.2% and never profitable at the operating line, fell further; IONOS is off 23.2%, Shopify 28.3%, and Cloudflare just 5.7%. This was not a sector that de-rated in unison and dragged GoDaddy with it. The market repriced GoDaddy specifically, and it did so from a valuation the stock still held as recently as early 2025. The expectations base a buyer inherits today is therefore a fresh, only-partly-recovered reset, not a long-settled cheap multiple.
The discount is keyed to growth
The paradox the report opened on lands hardest here: the cheapest cash multiple in the group sits on the best cash economics in the group. GoDaddy's trailing free-cash-flow yield was 11.6% in FY2025 against a 4.0% peer median — 2.91x the median, a 763-basis-point gap — while it simultaneously posted the peer set's highest free-cash-flow margin (31.8% versus 21.1%) and operating margin (22.8% versus 8.2%).
Source: FY2025 figures per company filings, as reported (peer margins, yields and drawdowns from reported financials and prices).
The two right-hand columns make the pricing logic legible. The market is paying up for growth and discounting its absence, almost regardless of cash. Shopify and Cloudflare, compounding near 30%, carry trailing free-cash-flow yields of 0.9% and 0.3% — the market capitalizes their cash at more than 100 times. GoDaddy, growing 8.3%, is capitalized at roughly nine times its trailing free cash flow. The one metric on which GoDaddy trails badly is the top line, and the multiple keys off exactly that. The discount is not a penalty for poor profitability, weak conversion, or balance-sheet risk; it is a penalty for a growth rate that runs 1,326 basis points below the peer median — the deliberate, partly one-time deficit the monetization engine and the AI question already dissected.
The positioning is clearest plotted directly — cash yield against growth, each bubble sized to market value.
Source: FY2025 revenue growth and trailing FCF yield per company filings; market capitalizations as reported (2026-07-27).
GoDaddy and IONOS occupy the same low-growth, high-yield corner — the two incumbents monetizing an installed base rather than buying logos. The market treats both as cash-return stories. What separates GoDaddy is that it earns the richest cash margin of the five while sitting at the second-lowest growth, and it was punished hardest for the combination.
What the price implies
The multiple translates into ownership arithmetic. At $96.41 the equity is capitalized at about nine times trailing free cash flow — a 11.6% trailing yield that consensus lifts to 13.3% on FY2026 estimates. On reported earnings the picture is lumpier and higher, because GAAP EPS still carries the tax distortions the management chapter unpicked: consensus GAAP EPS of roughly $7.12 for FY2026 and $8.97 for FY2027 put the stock at about 13.5x and 10.7x, while the company's own normalized (non-GAAP) earnings basis sits lower still. Free cash flow, not GAAP EPS, remains the truest denominator for this model, and on it the multiple is single-digit.
Market cap ($B)
Drawdown, 3yr high
Fwd FCF yield (FY26E)
Fwd P/E (FY27E)
Net leverage
Sources: market cap and drawdown as reported (2026-07-27); forward FCF yield from consensus estimates; forward P/E on consensus FY2027 GAAP EPS; net leverage per the Q1 FY2026 earnings call [1].
The equity multiple flatters the enterprise slightly, because GoDaddy carries debt. Long-term borrowings totalled $3.83 billion at face across term loans and senior notes maturing 2027 through 2031, against $1.08 billion of cash — net debt of about $2.70 billion, which management frames as roughly 1.4x trailing EBITDA, inside its target range [2] [3] [4]. That lifts enterprise value to roughly $16.3 billion, or about 10.3x FY2025 normalized EBITDA of $1,585.9 million — a company-defined, non-GAAP figure management sets and reconciles [5]. The leverage is modest and the maturity wall is staggered, so the balance sheet is not what set the price; the growth rate is.
What that price implies for a holder's return is mostly cash, not re-rating. GoDaddy returns essentially all of its free cash flow through buybacks — more than 95% over the last four years, $1.60 billion in FY2025 alone, equal to about 12% of today's market value — and the capital-allocation record shows that spend converting into a net 3.2% annual reduction in the diluted share count after stock compensation is re-issued [6] [7]. Hold the multiple constant and the return decomposes into two levers: mid-single-digit growth in free cash flow, plus the per-share uplift from shrinking the count. On a roughly 13% forward free-cash-flow yield deployed almost entirely into repurchases, that arithmetic points to a low-teens per-share compounding of free cash flow before any change in the multiple. A buyer at $96.41 is underwriting cash return and share-count shrink; multiple expansion is optional upside that rides on the growth rate re-rating, and multiple compression is the risk if it slips further.
Consensus, both ways
The sell side prices the post-drawdown stock as roughly fair, and its internal signals point in opposite directions. The median twelve-month target is $100 — about 4% above spot — with a mean of $111.9, a high of $190 and a low of $83; the ratings mix is nine buy or better against eight holds and no sells across seventeen analysts. That is a group that has marked the stock to approximately fair value after the fall, not one calling a bargain or a trap.
Source: consensus analyst price targets and recommendation mix, as reported (17 analysts).
Underneath the targets, the fundamental signals genuinely conflict. Revenue keeps landing where management guides — Q1 FY2026 printed at the high end of the guide, and FY2024 and FY2025 grew 7.5% and 8.3% at the top of their bands — yet reported GAAP EPS has been the lumpier line, distorted by the one-off tax items rather than by operations. Estimates tell a stabilization story, not a fresh upcycle: FY2026 and FY2027 consensus EPS have ticked up modestly over the past ninety days after earlier cuts, with a single downward revision logged in the last thirty days. The unresolved question the price poses is whether the 55% fall corrected a genuine over-valuation — the stock did, after all, briefly carry a 30%-grower's multiple on an 8%-grower's business — or overshot it, leaving a cash machine capitalized as if its growth will keep fading. The evidence does not settle that here; what settles it is whether monetization durability holds, and that is checkable on a schedule.
The tests ahead
The prior acts each left a live thread. Collected, they are the specific, dated variables that will re-rate or re-derate the multiple — the things a buyer at this price is actually underwriting, each with a filing and a threshold that would change the read.
Sources: FY2026 bookings-parity guidance and buyback pace, Q1 FY2026 earnings call [8] [9]; ARPU and customer metrics, FY2025 10-K [10].
The first two are the near-term proof points. Management told investors that Q1 FY2026 was the deliberate low of the year — bookings grew 3% against the .CO registry contract expiry, an aftermarket compare, and a promotional reset — and that growth rates should run "at or above parity" with revenue through the back half [11] [12]. Because the base is flat at roughly 20.4 million customers, the whole top line now turns on ARPU, which reached $246 in the quarter on retention above 85% [13]. If bookings reaccelerate and ARPU keeps climbing, the growth-keyed discount has less to stand on; if bookings stay soft into 2027, the market's fade thesis gets its confirmation.
The third and fourth are the longer-dated swing. The variable this price is most sensitive to is monetization durability — whether GoDaddy can keep lifting revenue per customer on a base that is not growing, which in turn depends on domains staying the discovery front door as AI changes how people find things, and on the Airo and Agent Name Service bets converting the AI threat into a revenue line before it erodes the funnel. Both remain unsized in the filings; the AI response is real but pre-revenue, and management concedes "no one is insulated." The fifth is management's own tell: the buyback, the mechanism the whole return case leans on, has so far followed price up rather than leaning into the reset, and cash is now building on the balance sheet. Whether that capital finally meets the cheaper stock, or keeps waiting, is the clearest near-term signal of how management itself reads the same price this chapter has been decomposing [14].
The numbers behind GoDaddy Inc.: as-reported financial statements and company metrics for FY2021–FY2025, traced to the source filings, opened with the share-price history those statements have to justify. Every linked figure opens the exact page of the filing it was printed on, with the statement row highlighted. Amounts in US$ millions unless noted.
Reading notes: All figures in US$ millions as printed (10-K units line: 'In millions, except shares in thousands and per share amounts'); per-share values in US$; customer/domain counts shown as absolute (printed in thousands on the filing). Income statement and cash flow for FY2023–FY2025 are the three columns of the FY2025 Form 10-K (Statements of Operations p.139; Statements of Cash Flows p.143); FY2021–FY2022 are columns of the FY2022 Form 10-K (Operations p.144; Cash Flows p.148–149). Balance sheet: FY2024–FY2025 from the FY2025 10-K (p.138); FY2023 from the FY2024 10-K (p.131); FY2021–FY2022 from the FY2022 10-K (p.142). US 10-K balance sheets print two years each. FY2022 revenue line is labeled 'Applications commerce / Core platform'; from FY2023 the label is 'Applications and commerce'. Core platform components (Domains vs. Other) are reported in investor supplements, not the 10-K statements, so they are omitted here.
Share Price — Full Available History — 11 Years
The stock closed at $96.41 on Jul 27, 2026 — up 382% over the window shown (+14.9% a year), trading between $20.00 and $214.35. At that close the stock trades at 16× FY2025 diluted EPS as reported below.
Source: market price feed, weekly closes, sampled from 2,848 source observations, Mar 2015–Jul 2026. Price return only, excludes dividends.
Market capitalization $7.7bn.
Market cap = 79.8M shares outstanding × the Jul 27, 2026 close of $96.41. Market-derived, shown without filing links.
FY2025 at a Glance
Revenue (US$ millions)
Operating income (US$ millions)
Net income (US$ millions)
Diluted EPS
Source: FY2025 consolidated statements [1] [2]. Click any linked figure to open the filing page with the row highlighted.
Revenue by Product Line
| Revenue by Product Line | FY2021 | FY2022 | FY2023 | FY2024 | FY2025 |
|---|---|---|---|---|---|
| Applications and commerce | 1,128 | 1,280 | 1,430 | 1,653 | 1,889 |
| Core platform | 2,687 | 2,812 | 2,824 | 2,920 | 3,062 |
| Total revenue | 3,816 | 4,091 | 4,254 | 4,573 | 4,951 |
| Total revenue growth, derived | — | +7.2% | +4.0% | +7.5% | +8.3% |
Source: Consolidated Statements of Operations — revenue disaggregation (Applications & Commerce vs. Core Platform) [1] [2]. Click any linked figure to open the filing page with the row highlighted.
Segment EBITDA
| Segment EBITDA | FY2021 | FY2022 | FY2023 | FY2024 | FY2025 |
|---|---|---|---|---|---|
| Applications and Commerce Segment EBITDA | — | — | 594 | 739 | 857 |
| Core Segment EBITDA | — | — | 816 | 932 | 1,010 |
| Total Segment EBITDA | — | — | 1,411 | 1,671 | 1,867 |
Source: Note 17, Segment Information (Segment EBITDA by reportable segment). Disclosed for FY2023–FY2025 only; the two-segment EBITDA presentation was introduced with ASU 2023-07. [3]. Click any linked figure to open the filing page with the row highlighted.
Income Statement
Source: Consolidated Statements of Operations [1] [2]. Click any linked figure to open the filing page with the row highlighted.
Columns marked E are consensus analyst estimates from S&P Capital IQ (CapIQ), shown alongside reported results for direct comparison; they are not company guidance.
Estimate source: S&P Capital IQ (CapIQ) consensus, as of 2026-07-28. Estimate figures are S&P Capital IQ consensus (vendor data — no filing page links). EPS and net income use the normalized (adjusted) consensus where the street reports it. Line-item analyst models (segments, drivers, KPIs) are in the Visible Alpha tab.
Balance Sheet
Source: Consolidated Balance Sheets [4] [5] [6]. Click any linked figure to open the filing page with the row highlighted.
Cash Flow
Source: Consolidated Statements of Cash Flows [7] [8]. Click any linked figure to open the filing page with the row highlighted.
Revenue by Geography
| Revenue by Geography | FY2021 | FY2022 | FY2023 | FY2024 | FY2025 |
|---|---|---|---|---|---|
| U.S. | 2,545 | 2,757 | 2,873 | 3,113 | 3,324 |
| International | 1,271 | 1,334 | 1,381 | 1,460 | 1,627 |
| Total revenue | 3,816 | 4,091 | 4,254 | 4,573 | 4,951 |
Source: Note 3, Revenue Recognition — revenue by geography (customer billing address). FY2021–FY2022 from the standardized data feed. [9]. Click any linked figure to open the filing page with the row highlighted.
Key Operating Metrics
| Key Operating Metrics | FY2021 | FY2022 | FY2023 | FY2024 | FY2025 |
|---|---|---|---|---|---|
| Total bookings | 4,232 | 4,414 | 4,603 | 5,039 | 5,400 |
| Annualized recurring revenue (ARR) | 3,434 | 3,570 | 3,729 | 4,043 | 4,336 |
| Normalized EBITDA (NEBITDA) | 872 | 1,013 | 1,134 | 1,396 | 1,586 |
| Total customers (thousands) | 20,704 | 20,897 | 21,026 | 20,511 | 20,422 |
| Average revenue per user (ARPU) | 187.00 | 197.00 | 203.00 | 220.00 | 242.00 |
| Domains under management (thousands) | 84,400 | 83,857 | 83,554 | 81,013 | 80,793 |
Source: company filings [10] [11] [12] [13]. Click any linked figure to open the filing page with the row highlighted.
Customer Franchise Reinvestment
| Customer Franchise Reinvestment | FY2021 | FY2022 | FY2023 | FY2024 | FY2025 |
|---|---|---|---|---|---|
| Customer retention rate (%) | 85.0% | 85.0% | 85.0% | 84.0% | 85.0% |
| Bookings from GoDaddy Guides (% of total bookings) | — | — | 9.0% | 8.0% | 9.0% |
| Revenue from prior-year customers (% of total revenue) | — | — | — | — | 89.0% |
| Customers spending $500/year (thousands) | — | — | — | — | 2,000 |
| Equity-based compensation expense | 208 | 264 | 294 | 299 | 318 |
Source: company filings [14] [15] [16] [17]. Click any linked figure to open the filing page with the row highlighted.
Long-Term Record
| Fiscal year | Total revenue | Operating income | Net income attributable to GoDaddy Inc. | Diluted EPS | Net cash provided by operating activities |
|---|---|---|---|---|---|
| FY2016 | 1,848 | 50 | (16) | (0.21) | 386 |
| FY2017 | 2,232 | 67 | 136 | 0.94 | 476 |
| FY2018 | 2,660 | 150 | 77 | 0.48 | 560 |
| FY2019 | 2,988 | 203 | 137 | 0.79 | 723 |
| FY2020 | 3,317 | 272 | (495) | (2.94) | 765 |
| FY2021 | 3,816 | 382 | 242 | 1.42 | 829 |
| FY2022 | 4,091 | 499 | 352 | 2.19 | 980 |
| FY2023 | 4,254 | 547 | 1,375 | 9.08 | 1,048 |
| FY2024 | 4,573 | 894 | 937 | 6.45 | 1,288 |
| FY2025 | 4,951 | 1,127 | 875 | 6.22 | 1,599 |
Source: consolidated statements across filings; older years from the standardized feed [7] [1] [8] [2]. Click any linked figure to open the filing page with the row highlighted.
Operating KPIs
| KPI | FY2021 | FY2022 | FY2023 | FY2024 | FY2025 |
|---|---|---|---|---|---|
| Total customers at period end | 20,701,000 | 20,897,000 | 21,026,000 | 20,511,000 | 20,422,000 |
| Annualized recurring revenue | 3,434 | 3,570 | 3,729 | 4,043 | 4,336 |
| Total bookings | 4,232 | 4,414 | 4,603 | 5,039 | 5,400 |
| Domains under management | 84,400,000 | 83,857,000 | 83,554,000 | 81,013,000 | 80,793,000 |
Source: company-reported operating metrics [10]. Click any linked figure to open the filing page with the row highlighted.
Analyst Consensus
Mean target
Median target
High target
Low target
Street ratings: 7 strong buy, 2 buy, 8 hold. Consensus: Buy.
Estimate source: S&P Capital IQ (CapIQ) consensus, as of 2026-07-28. Estimate figures are S&P Capital IQ consensus (vendor data — no filing page links). EPS and net income use the normalized (adjusted) consensus where the street reports it. Line-item analyst models (segments, drivers, KPIs) are in the Visible Alpha tab.
Traceability
340 of 379 figures on this page (90%) link to the filing page where they are printed — click a linked figure to open the source PDF at that page with the row highlighted. Unlinked figures come from standardized data feeds or pre-filing years.
All figures in US$ millions as printed (10-K units line: 'In millions, except shares in thousands and per share amounts'); per-share values in US$; customer/domain counts shown as absolute (printed in thousands on the filing).
Income statement and cash flow for FY2023–FY2025 are the three columns of the FY2025 Form 10-K (Statements of Operations p.139; Statements of Cash Flows p.143); FY2021–FY2022 are columns of the FY2022 Form 10-K (Operations p.144; Cash Flows p.148–149).
Balance sheet: FY2024–FY2025 from the FY2025 10-K (p.138); FY2023 from the FY2024 10-K (p.131); FY2021–FY2022 from the FY2022 10-K (p.142). US 10-K balance sheets print two years each.
FY2022 revenue line is labeled 'Applications commerce / Core platform'; from FY2023 the label is 'Applications and commerce'. Core platform components (Domains vs. Other) are reported in investor supplements, not the 10-K statements, so they are omitted here.
FY2016–FY2020 long-term figures are from the standardized SEC-XBRL data feed and are shown without page links (those filings are outside the indexed corpus). FY2016–FY2020 EPS are feed values.
Segment EBITDA (Note 17) is disclosed for FY2023–FY2025 only; FY2021–FY2022 are left blank because the two reportable-segment EBITDA presentation began with ASU 2023-07 adoption in the FY2024 10-K.
Quarterly income statement and balance sheet are from the Q1–Q3 FY2025 and Q1 FY2026 Forms 10-Q and the Q4 FY2025 earnings release (8-K, 2026-02-24); the 10-Q income statements print single-quarter columns. Quarterly single-quarter operating cash flow is derived from the printed year-to-date statements and reconciles exactly to the data feed.
1 figure(s) differed between the data feed and the filing; the filing value is shown (see the run's metrics/metrics_tab.json for the audit trail).
GoDaddy Inc.'s management explains the business in its own materials. The slides below do the most of that work, pulled from the documents preserved in Sources. Each source link opens the complete presentation at that slide in a new tab.
Company Overview (May 2026) — Q1 2026
GoDaddy's current, self-contained overview deck — the fastest route from zero to understanding what the company does, how the two segments make money, and where the AI (Airo/ANS) story and the financials stand today. · Open the full document →

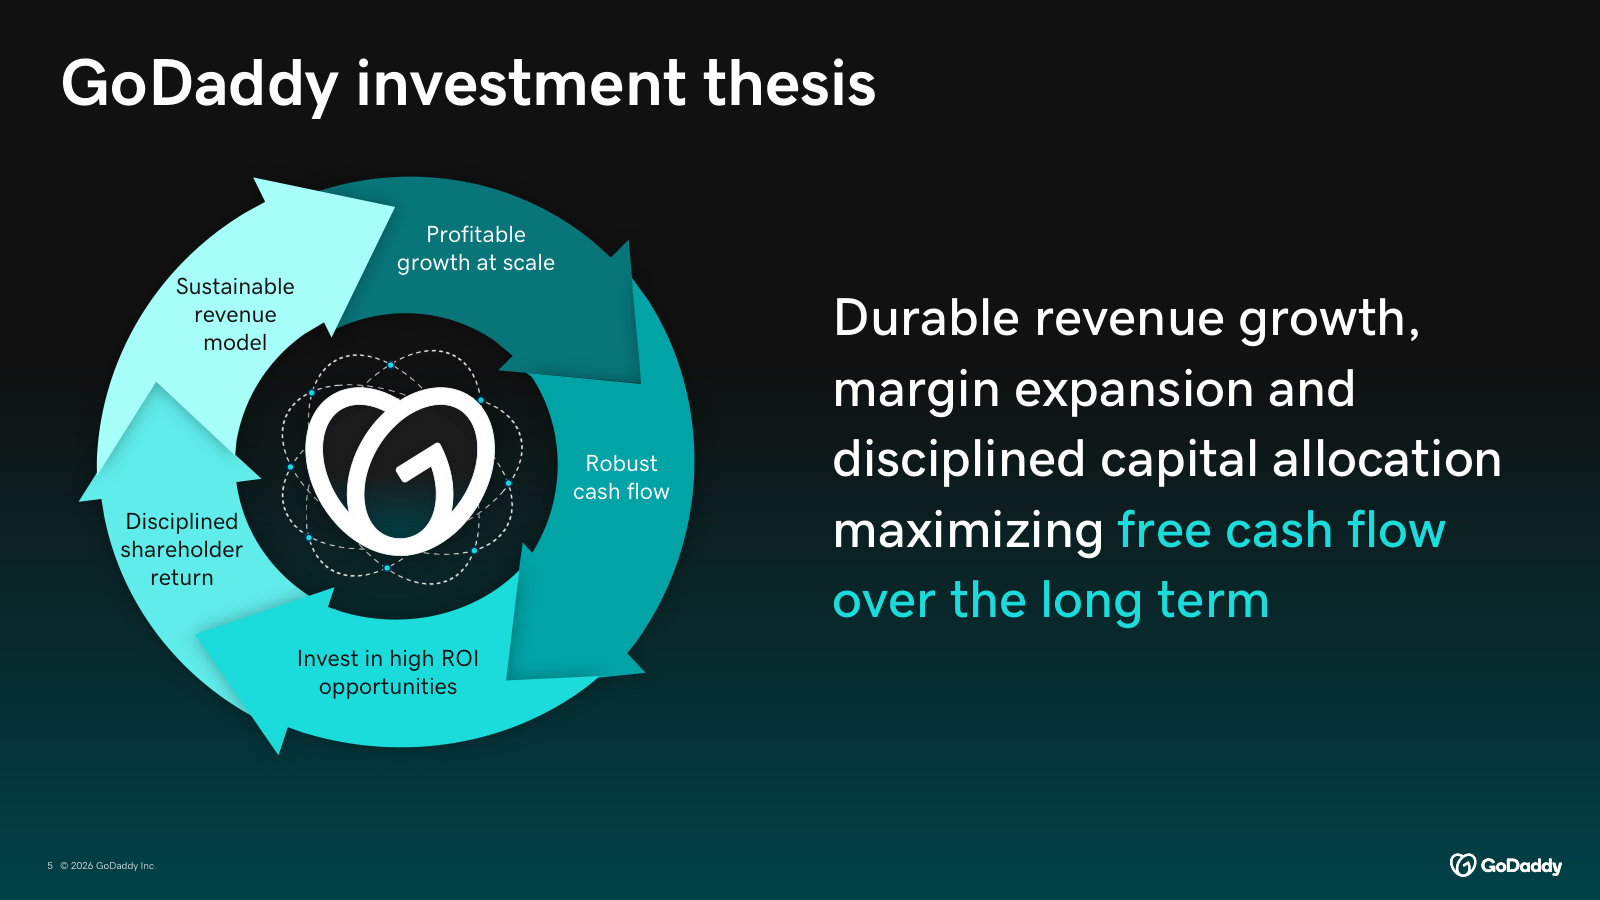
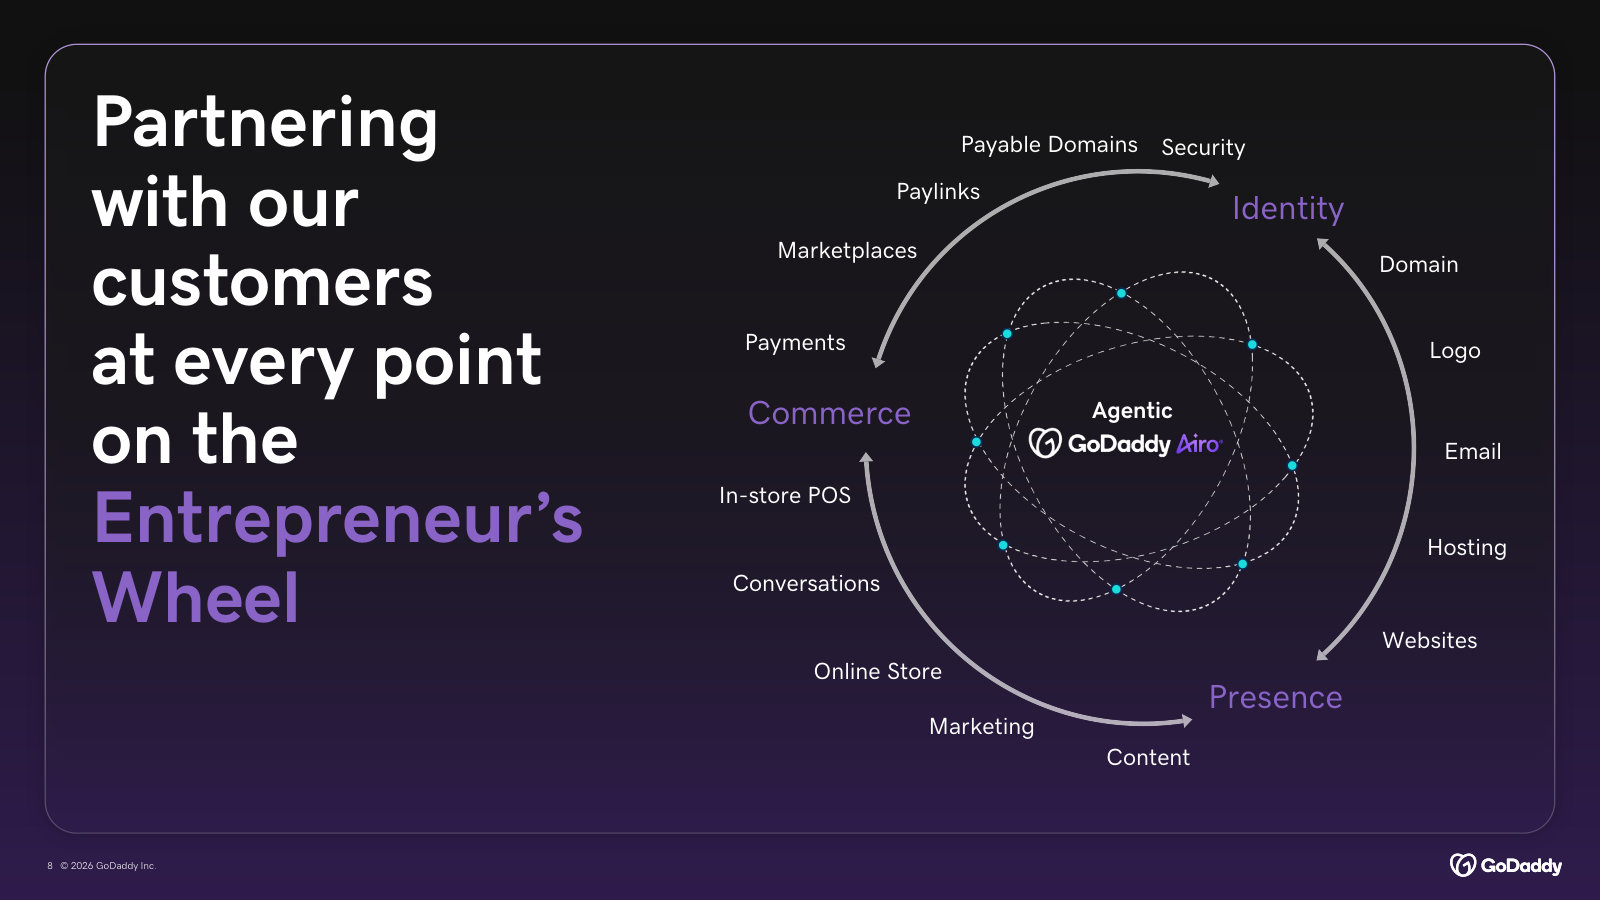
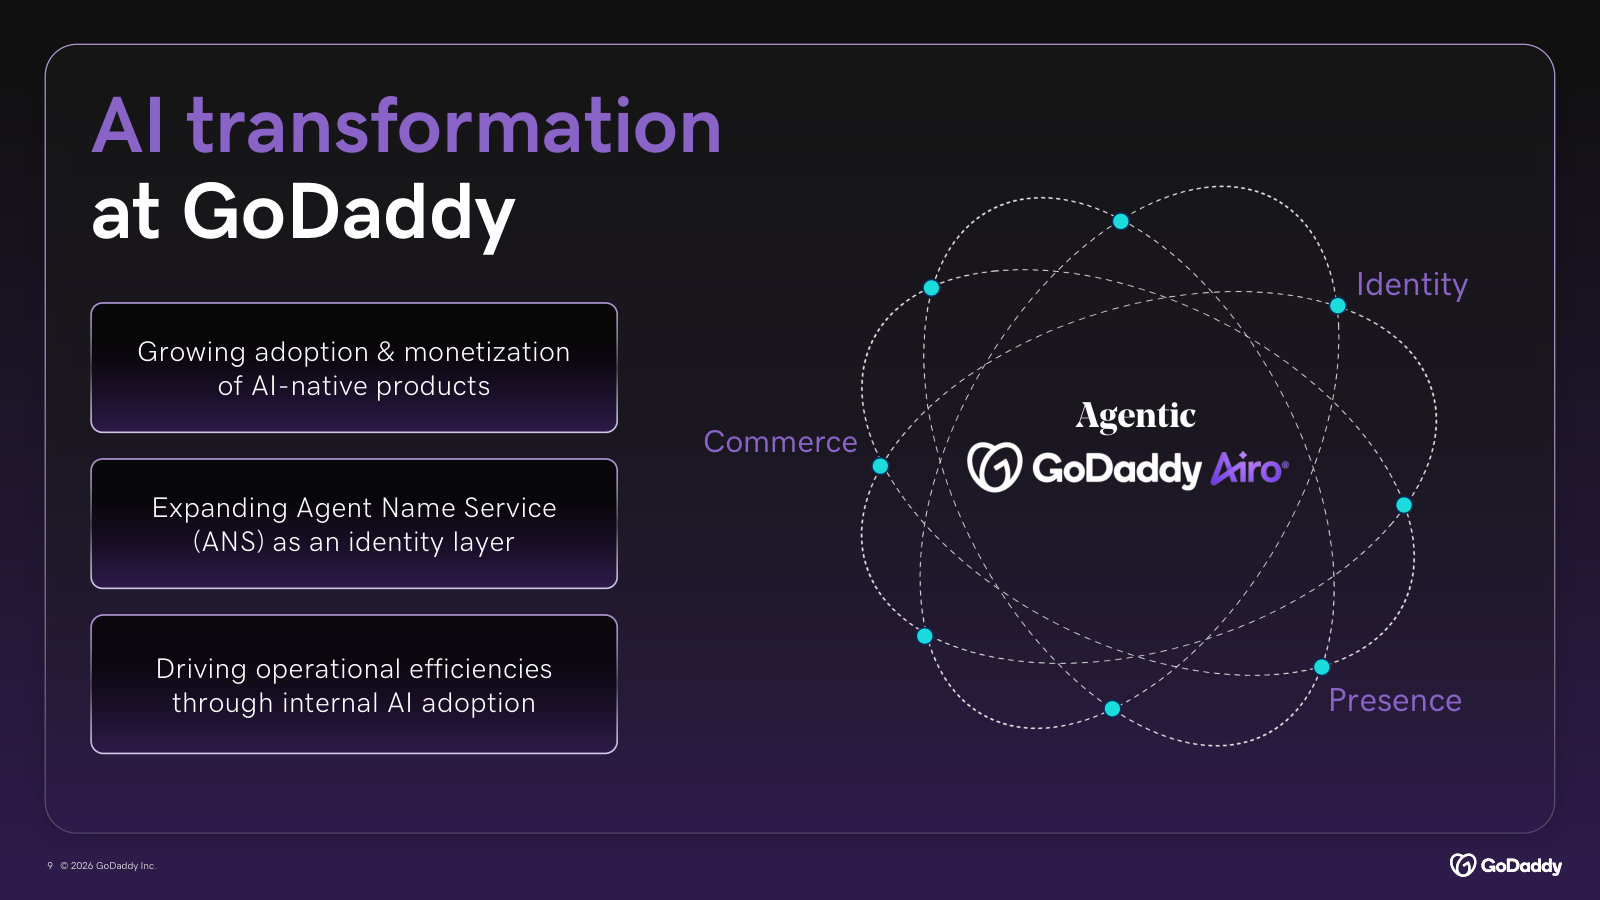
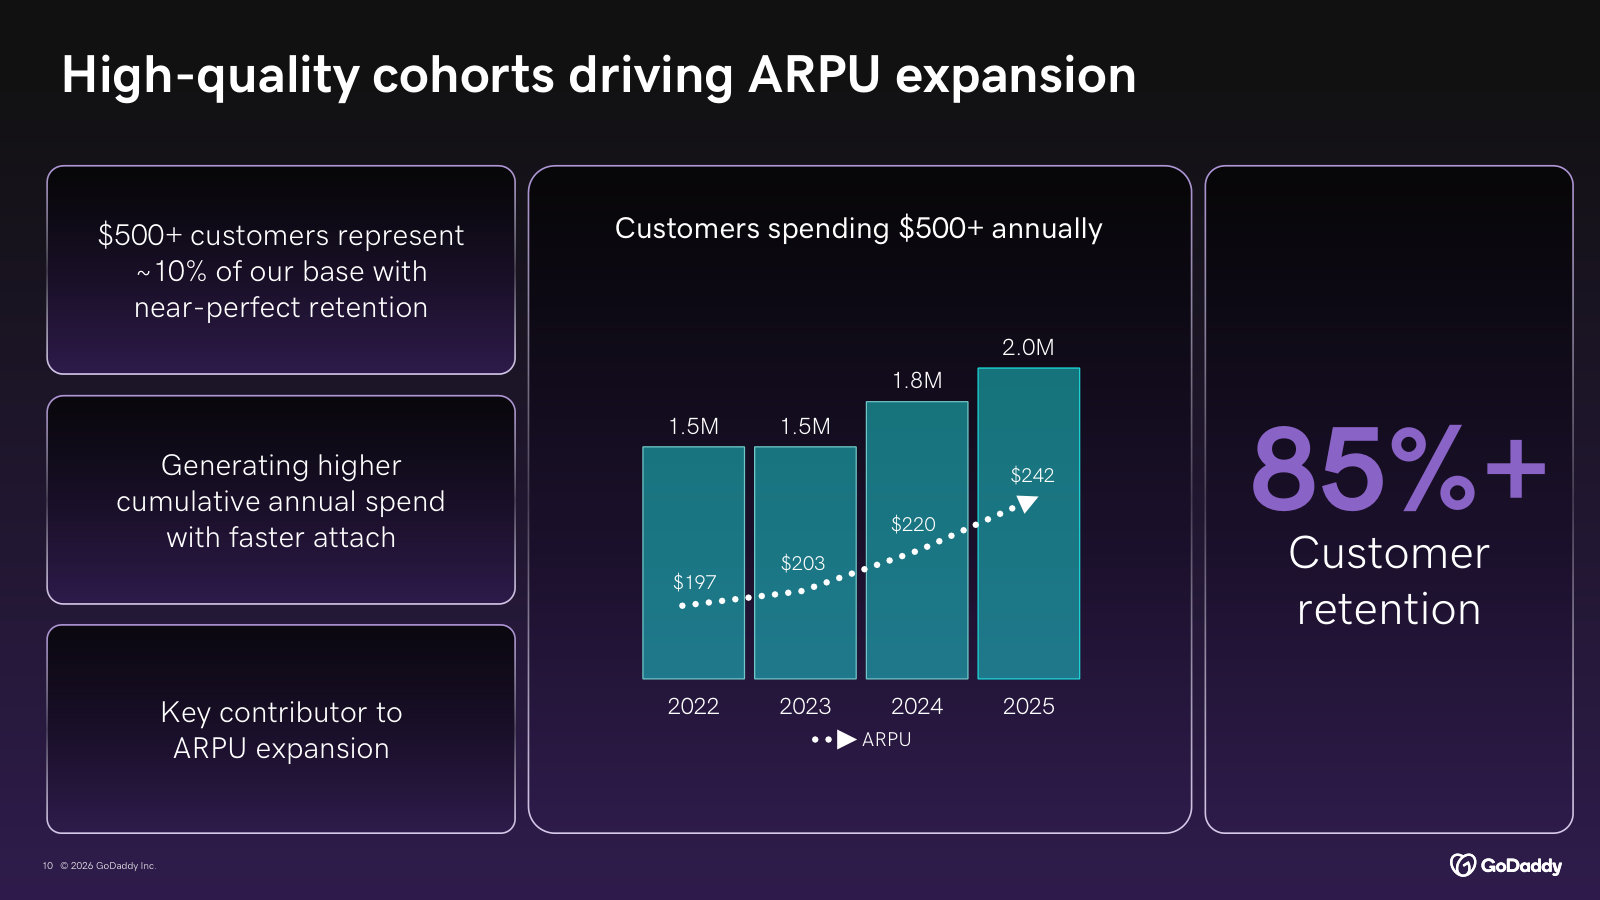
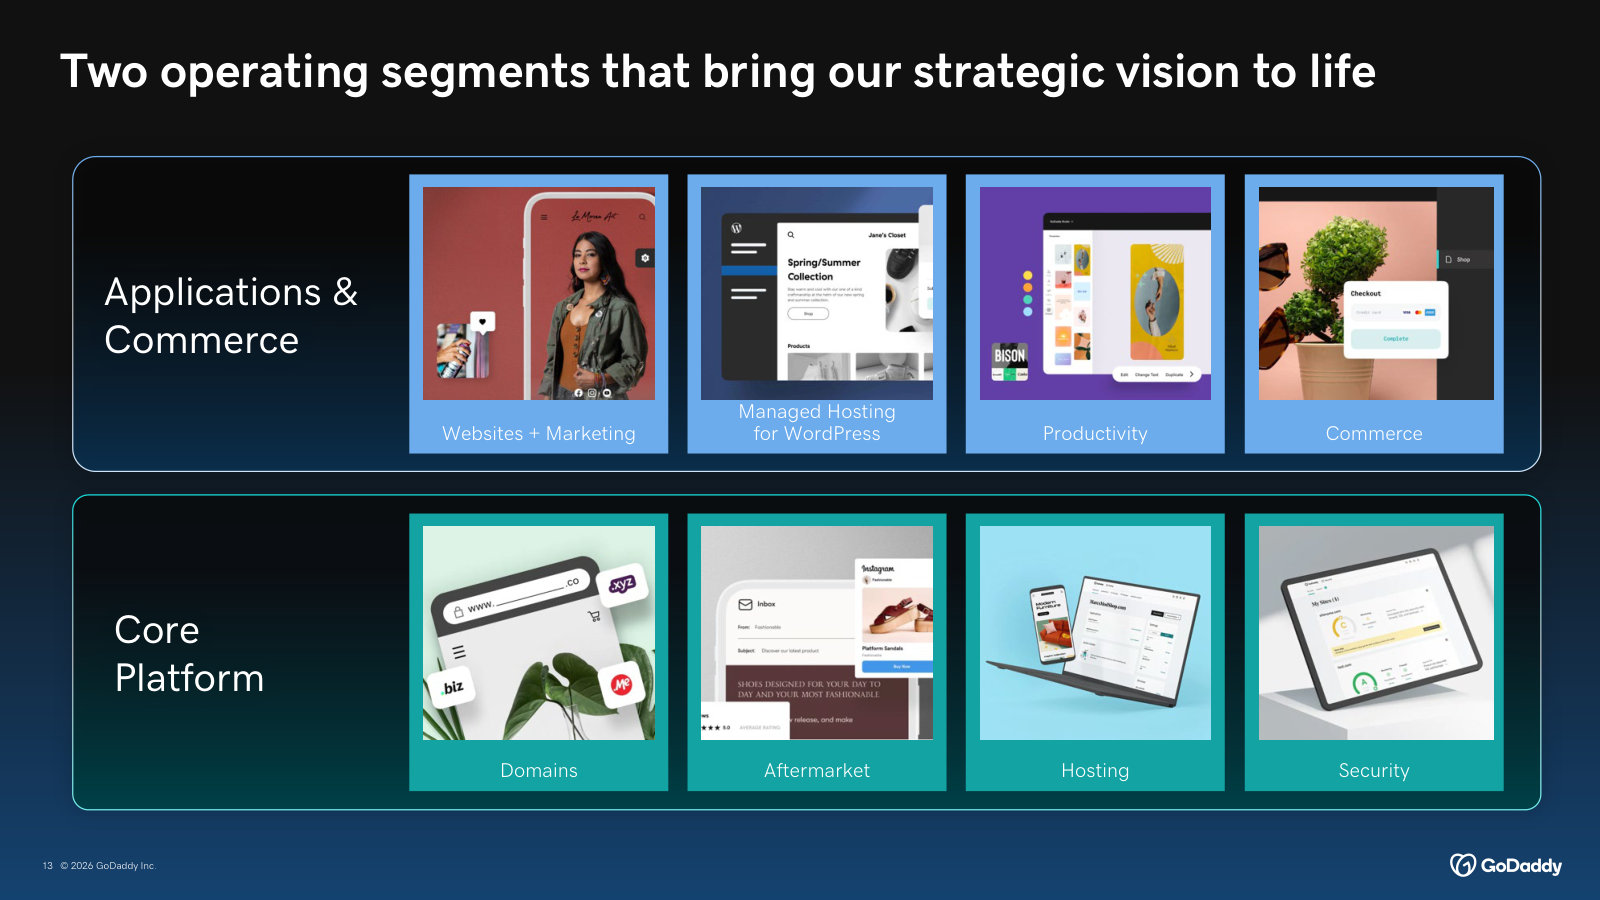
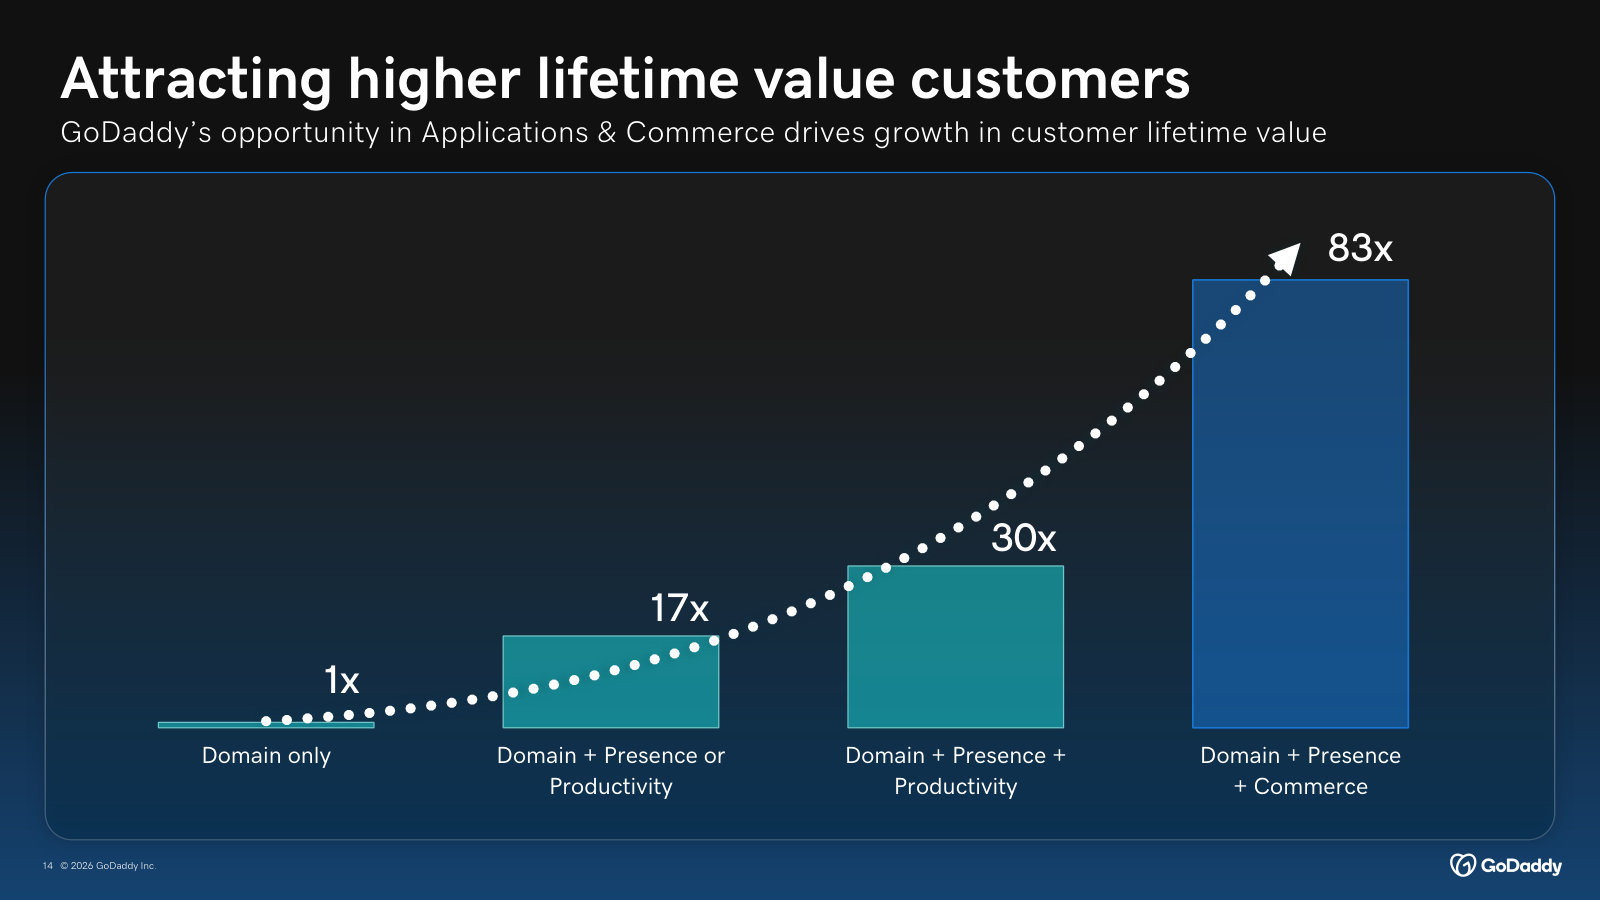
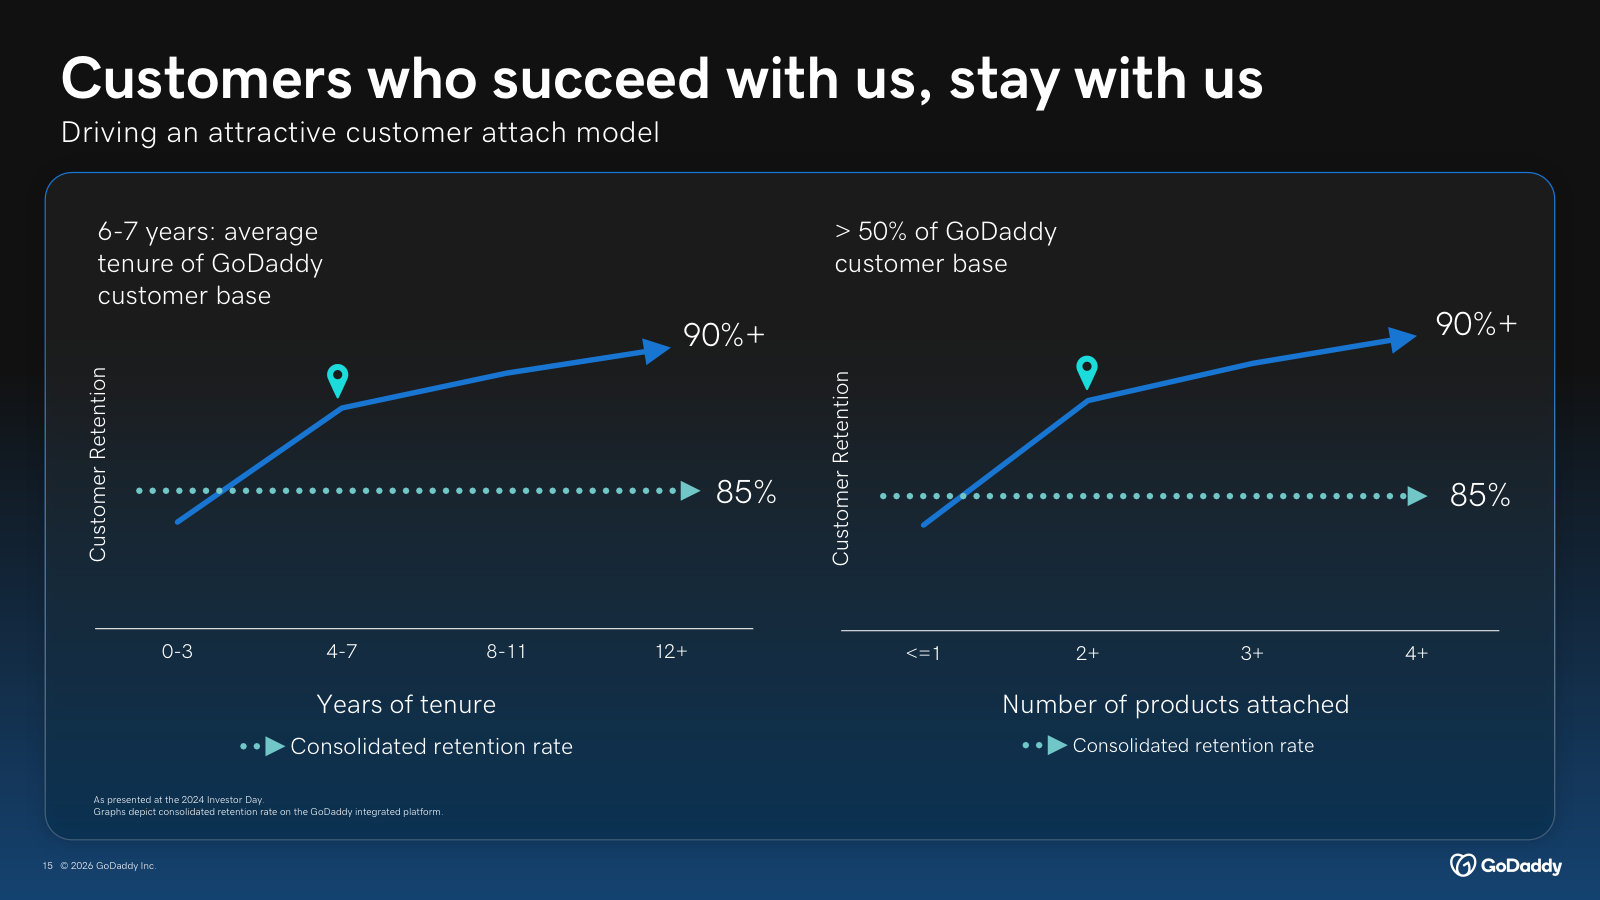
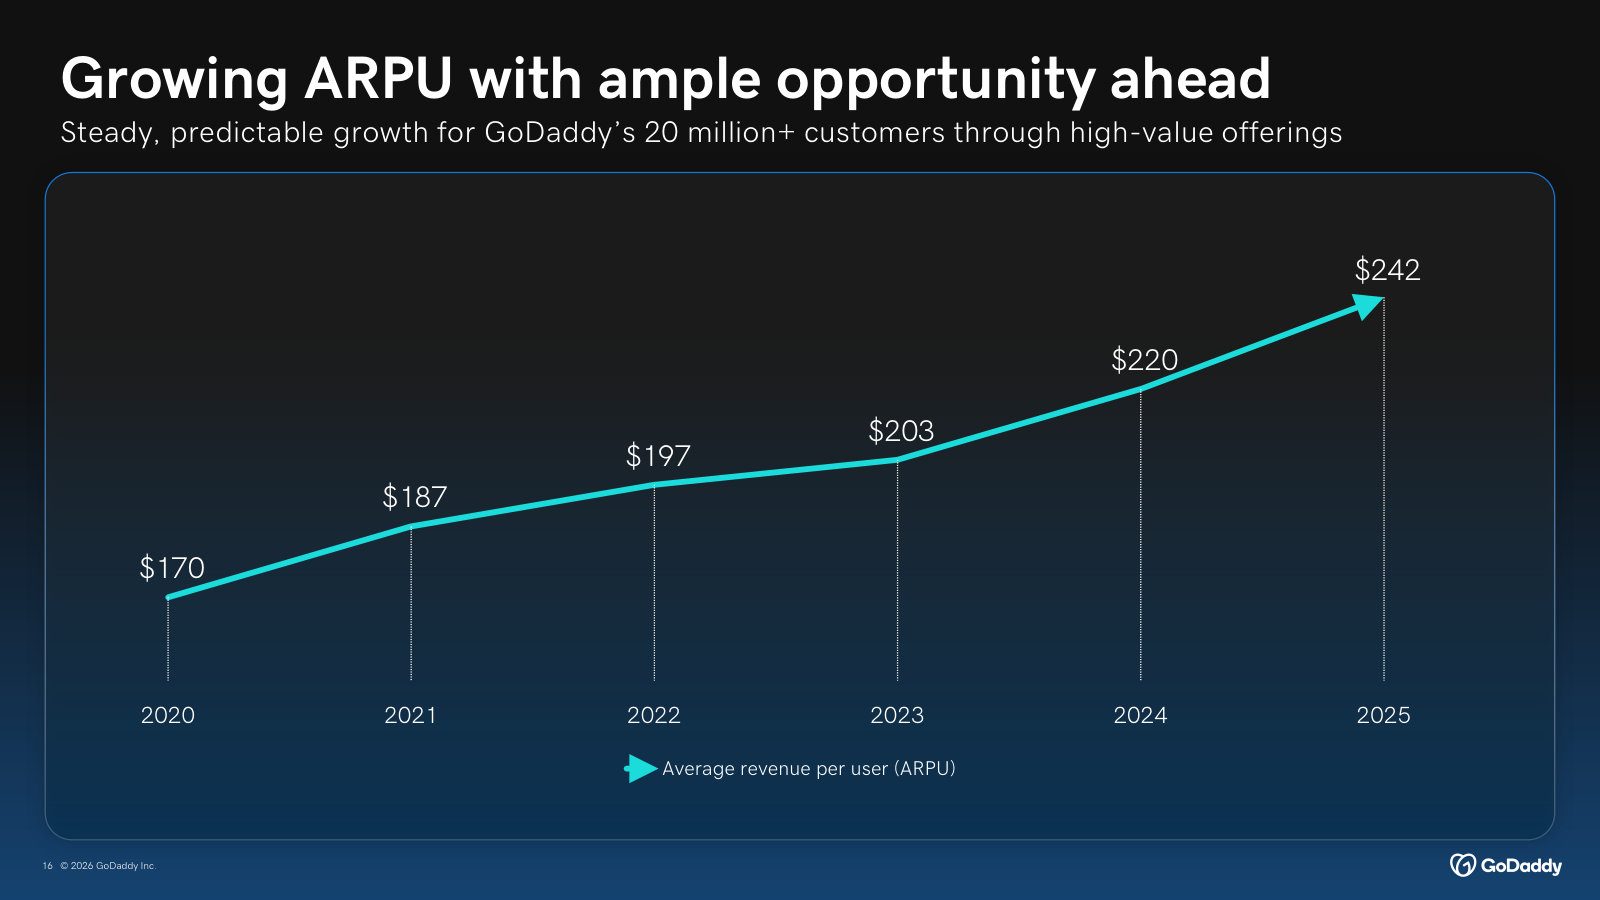

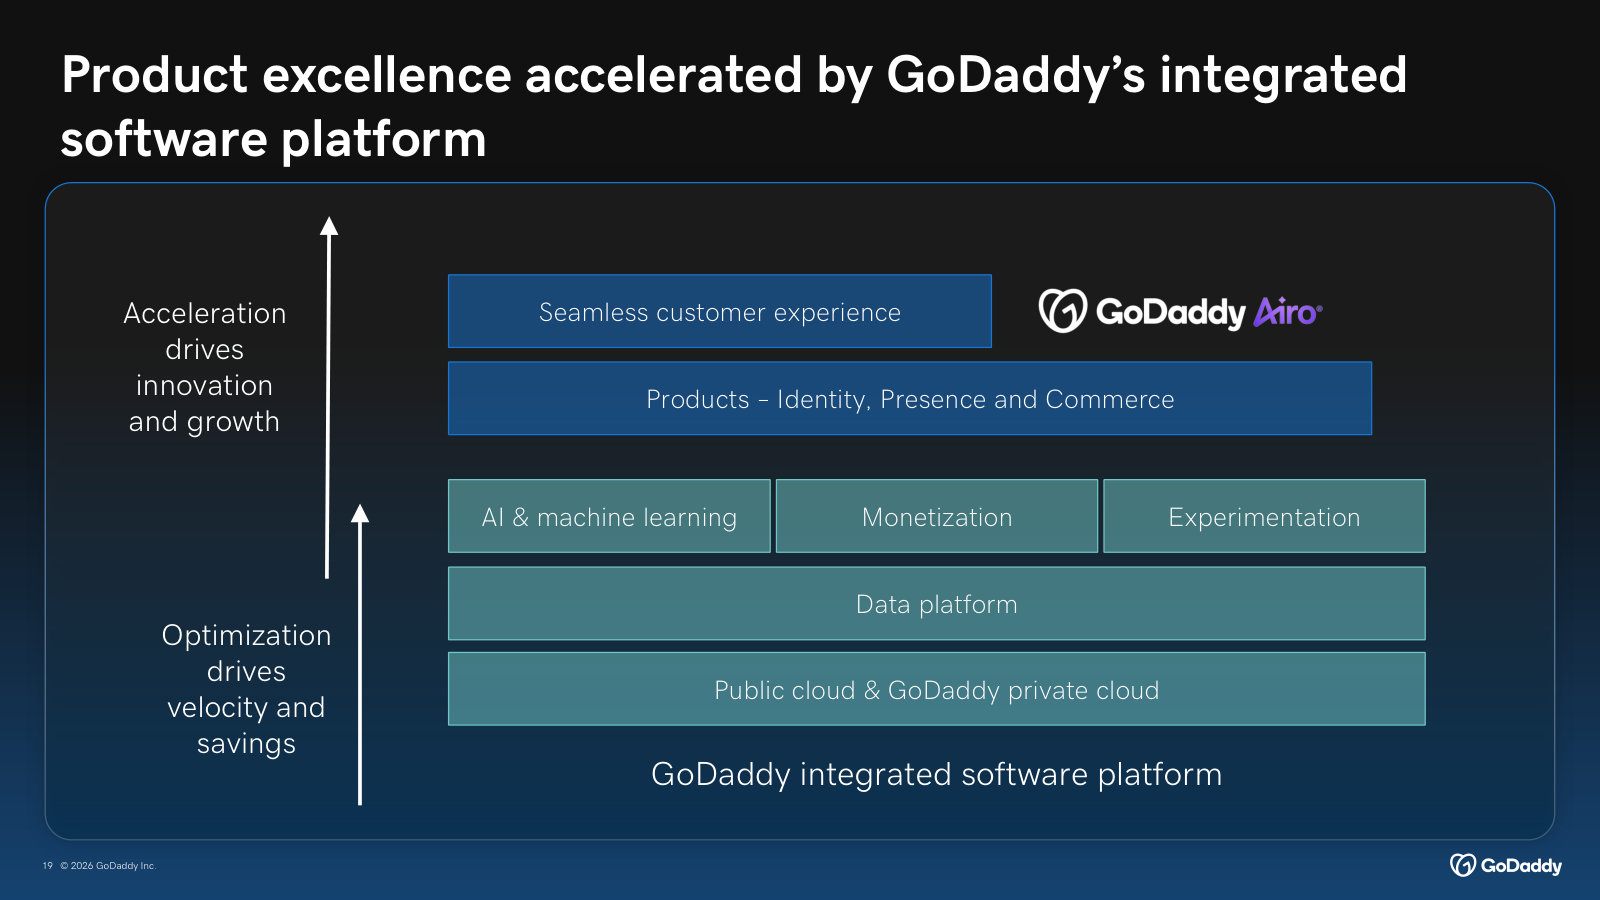
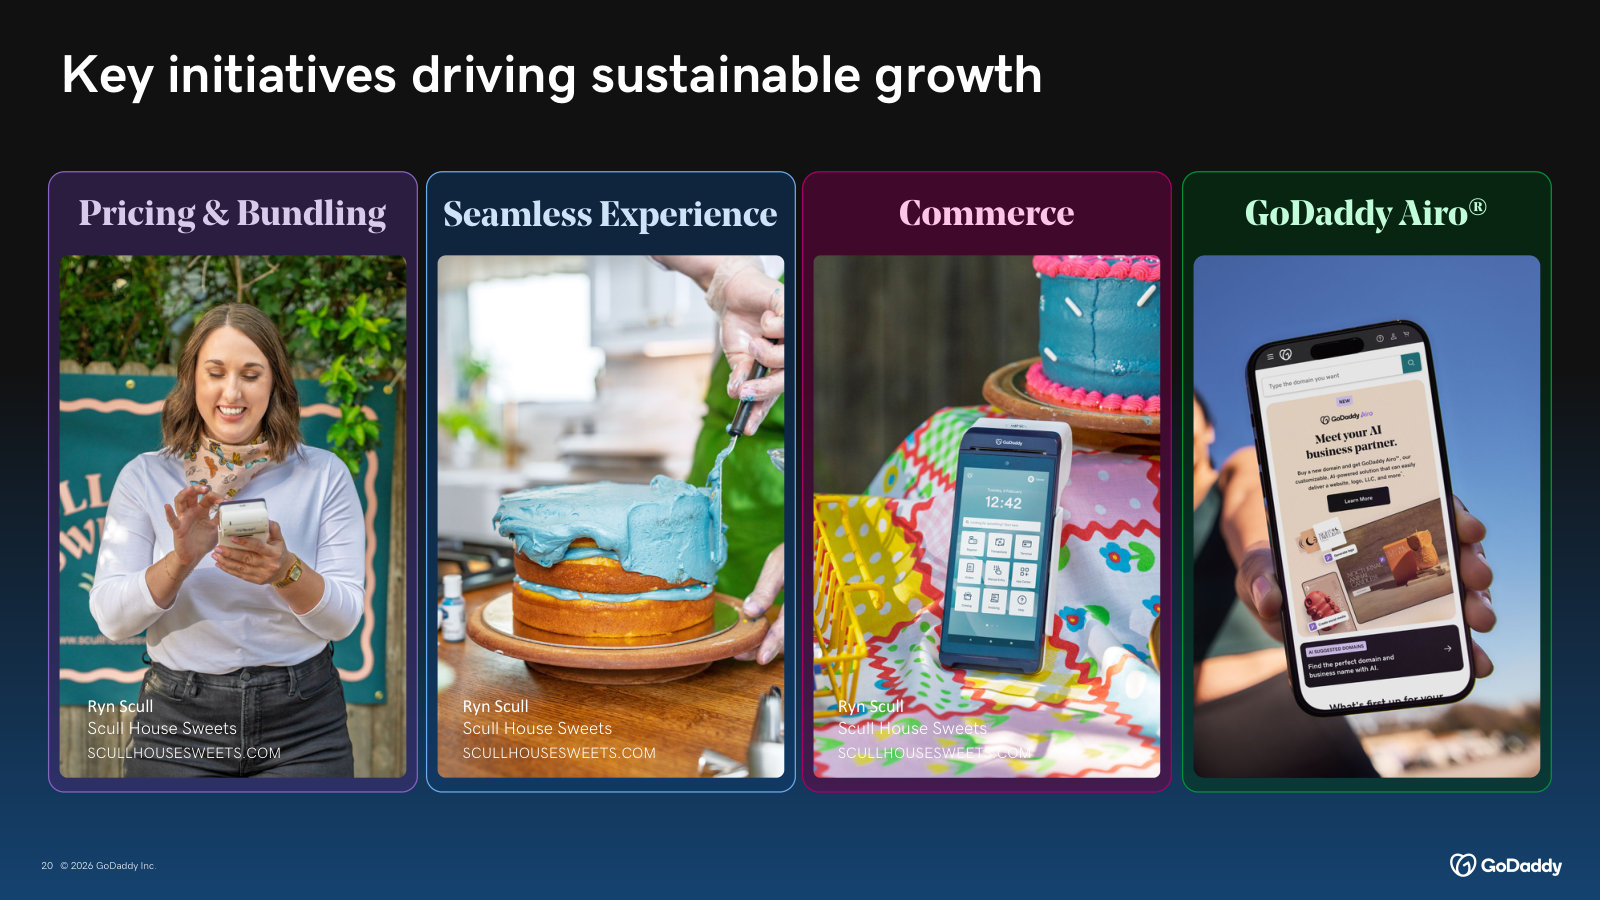
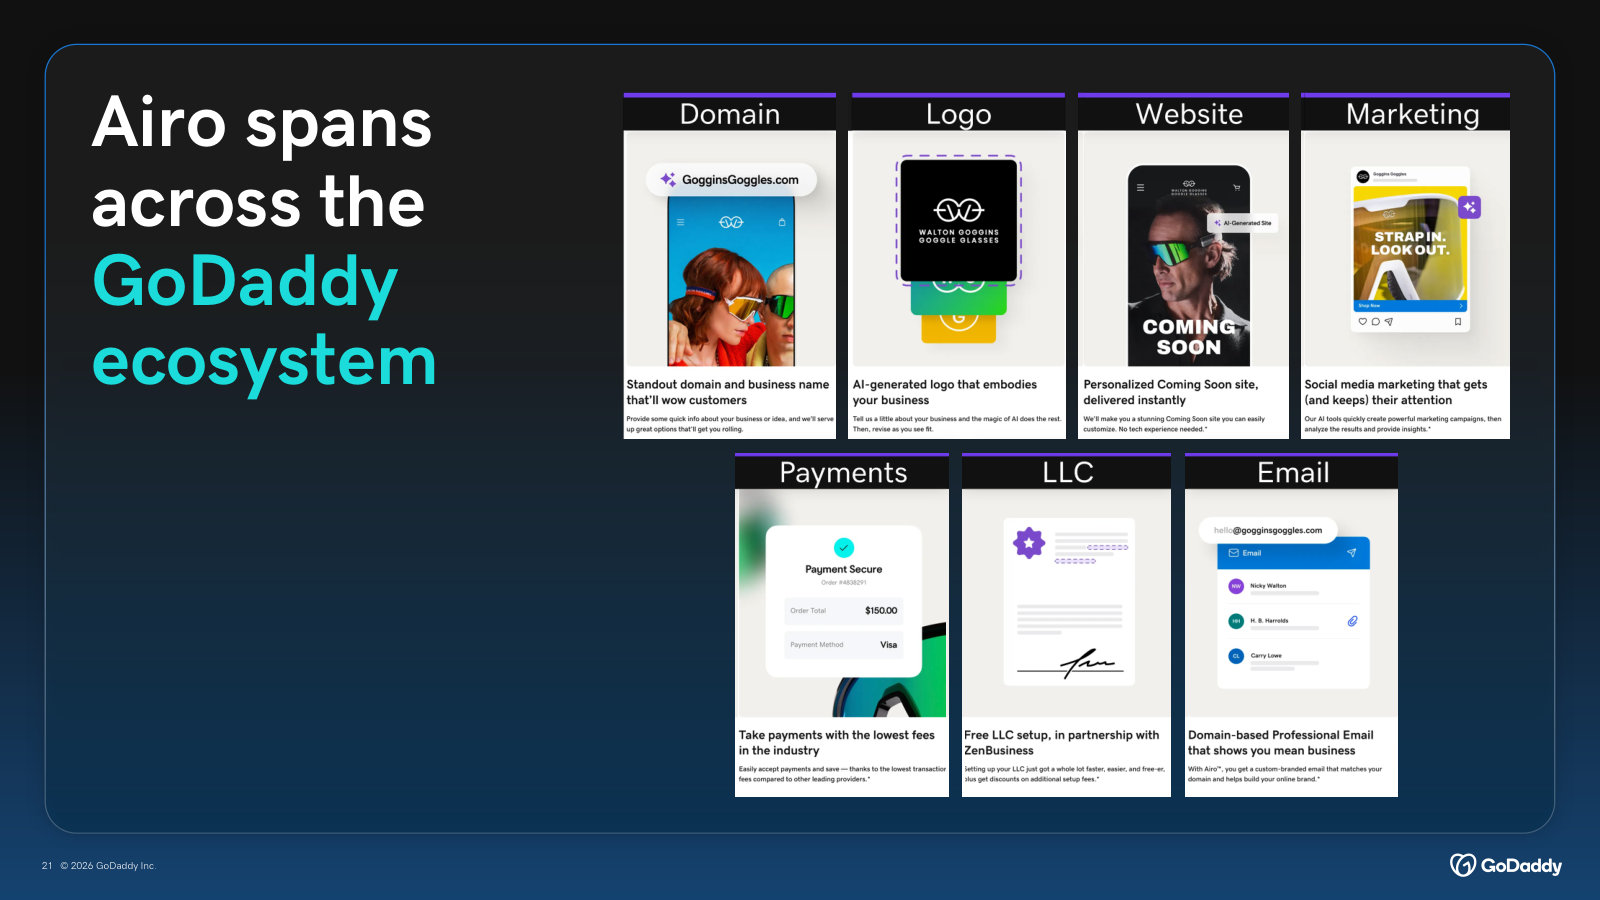
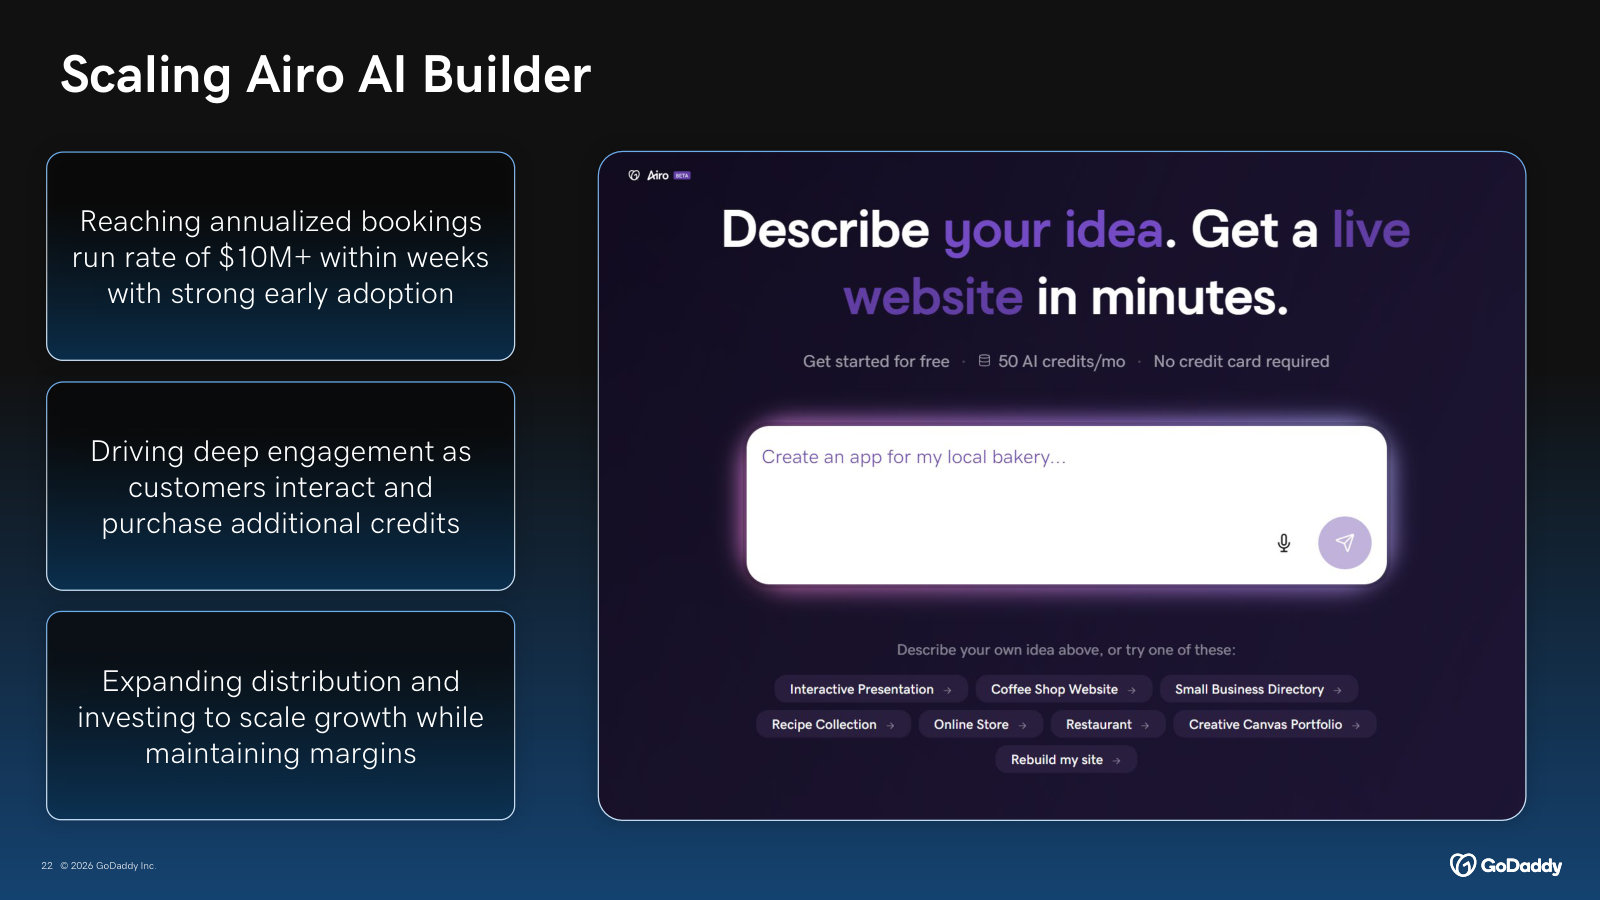
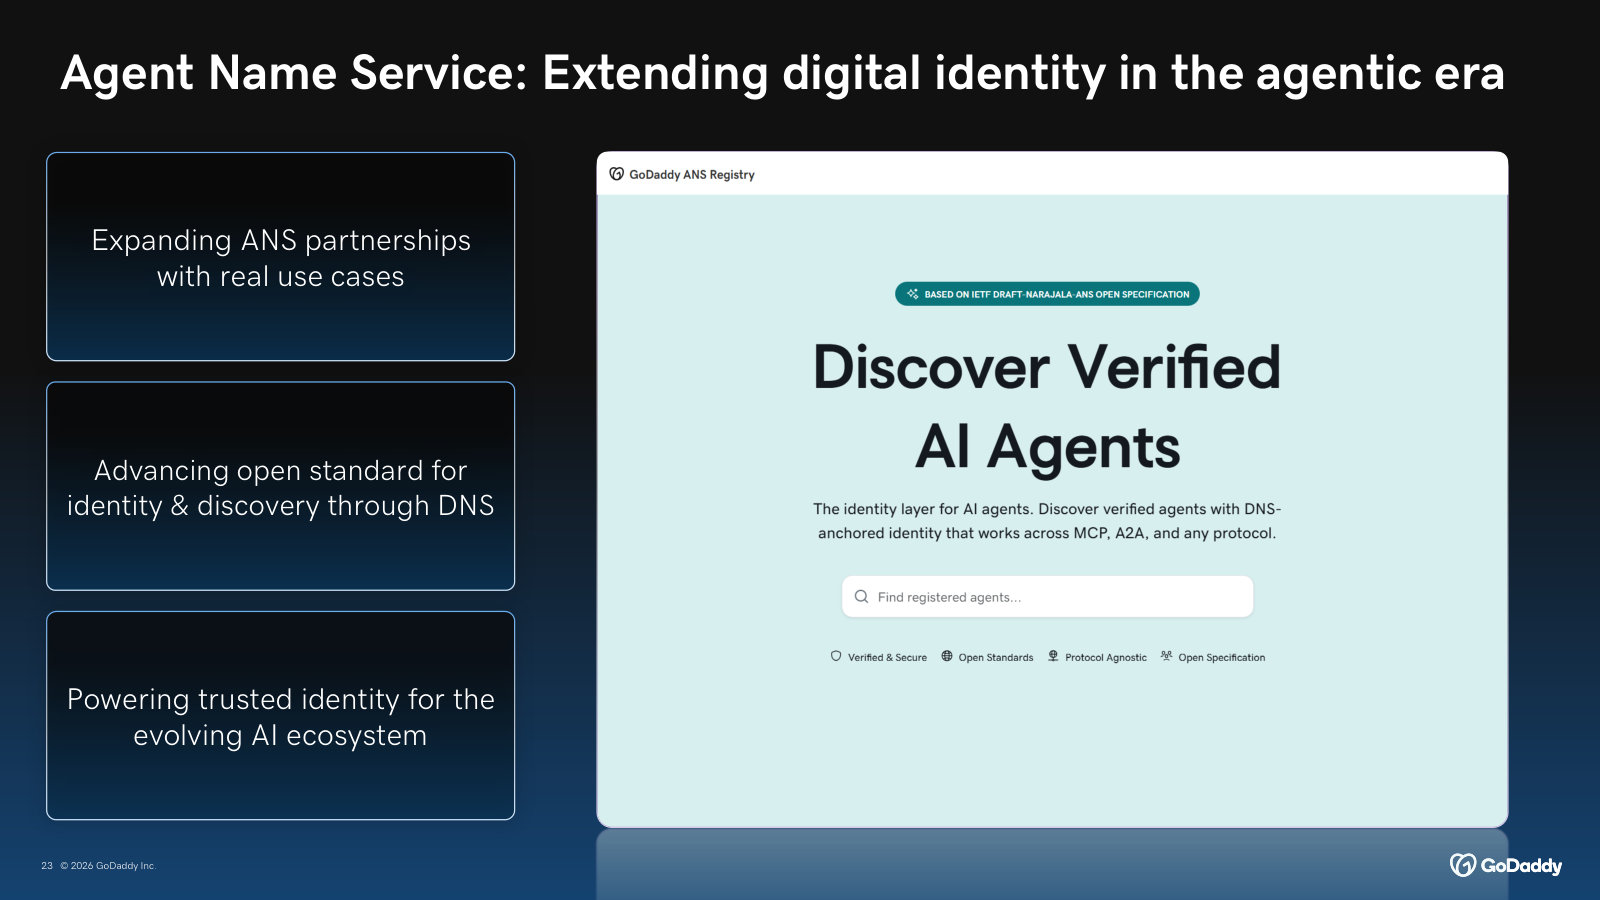
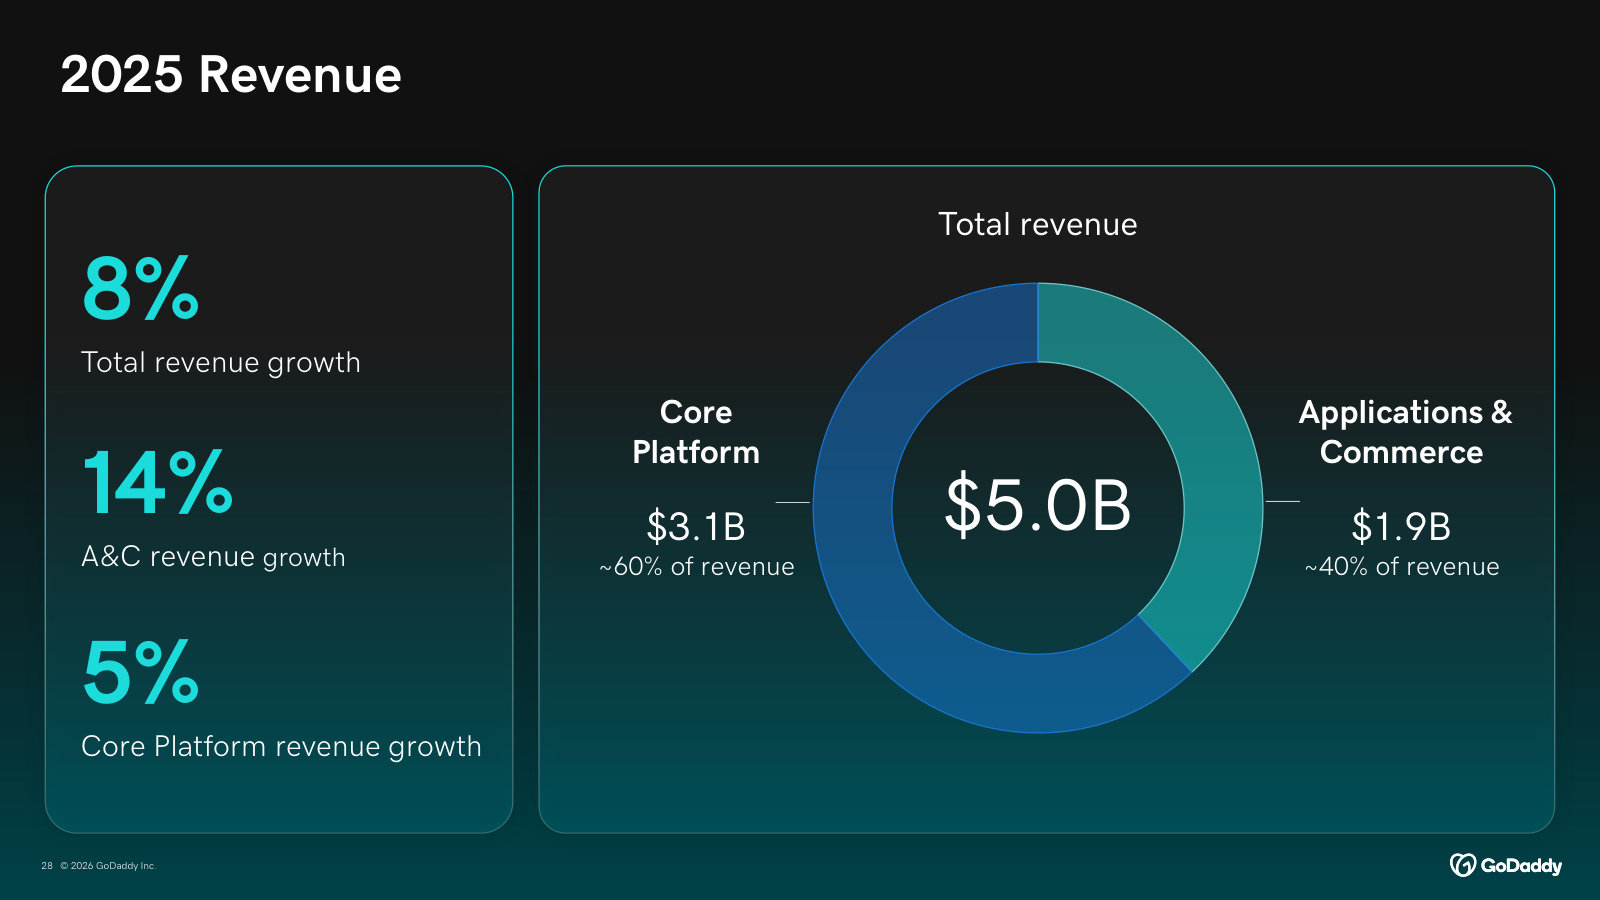
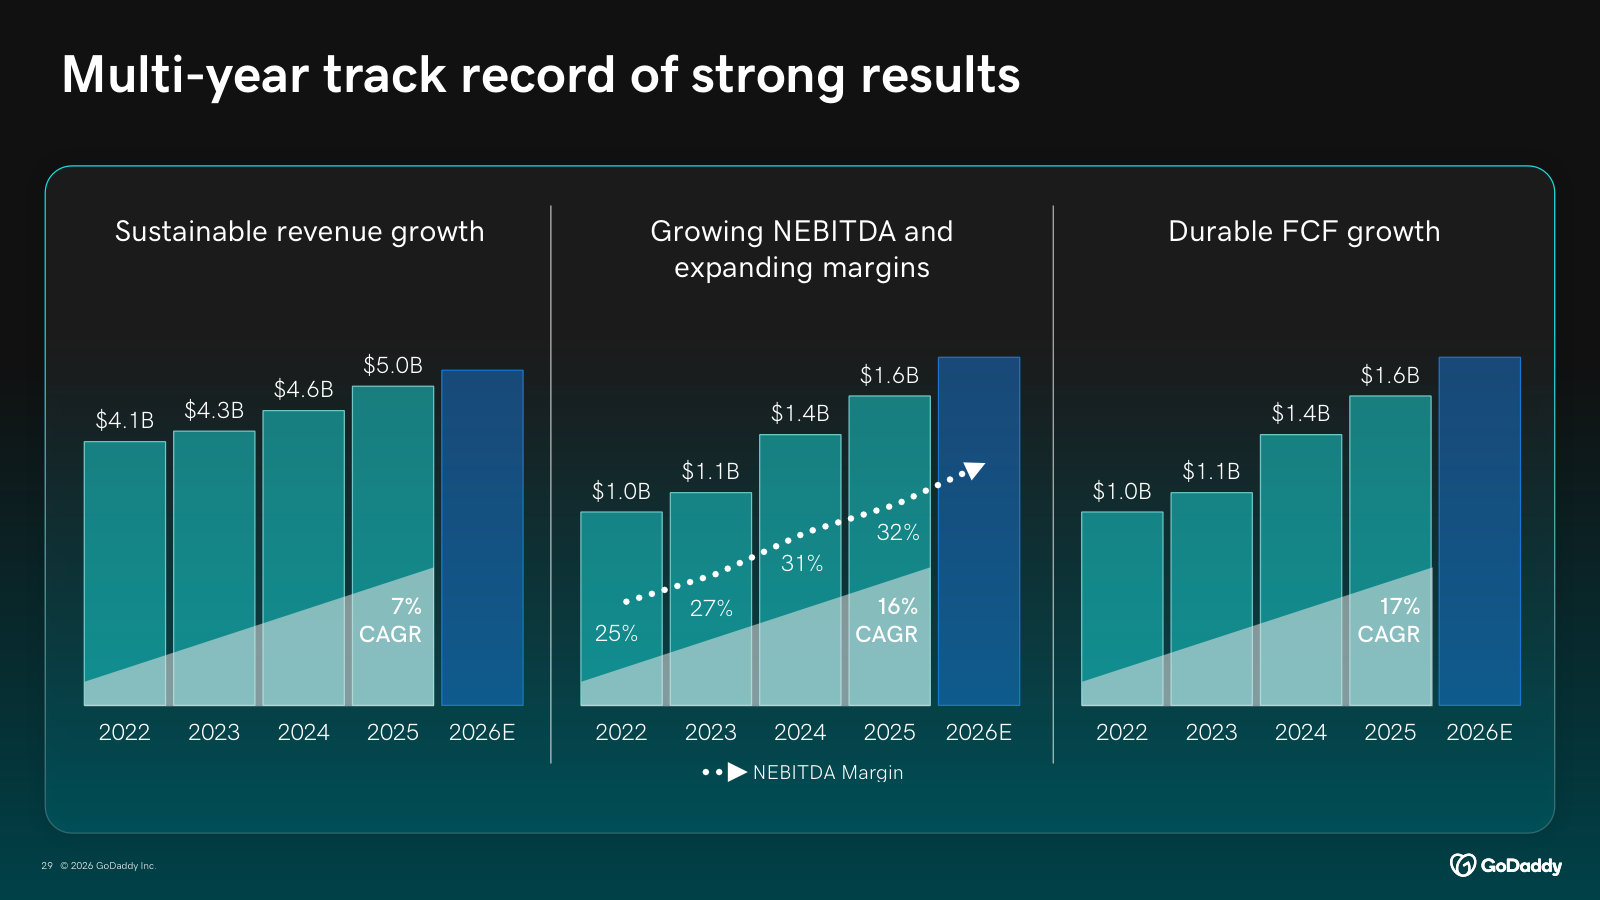
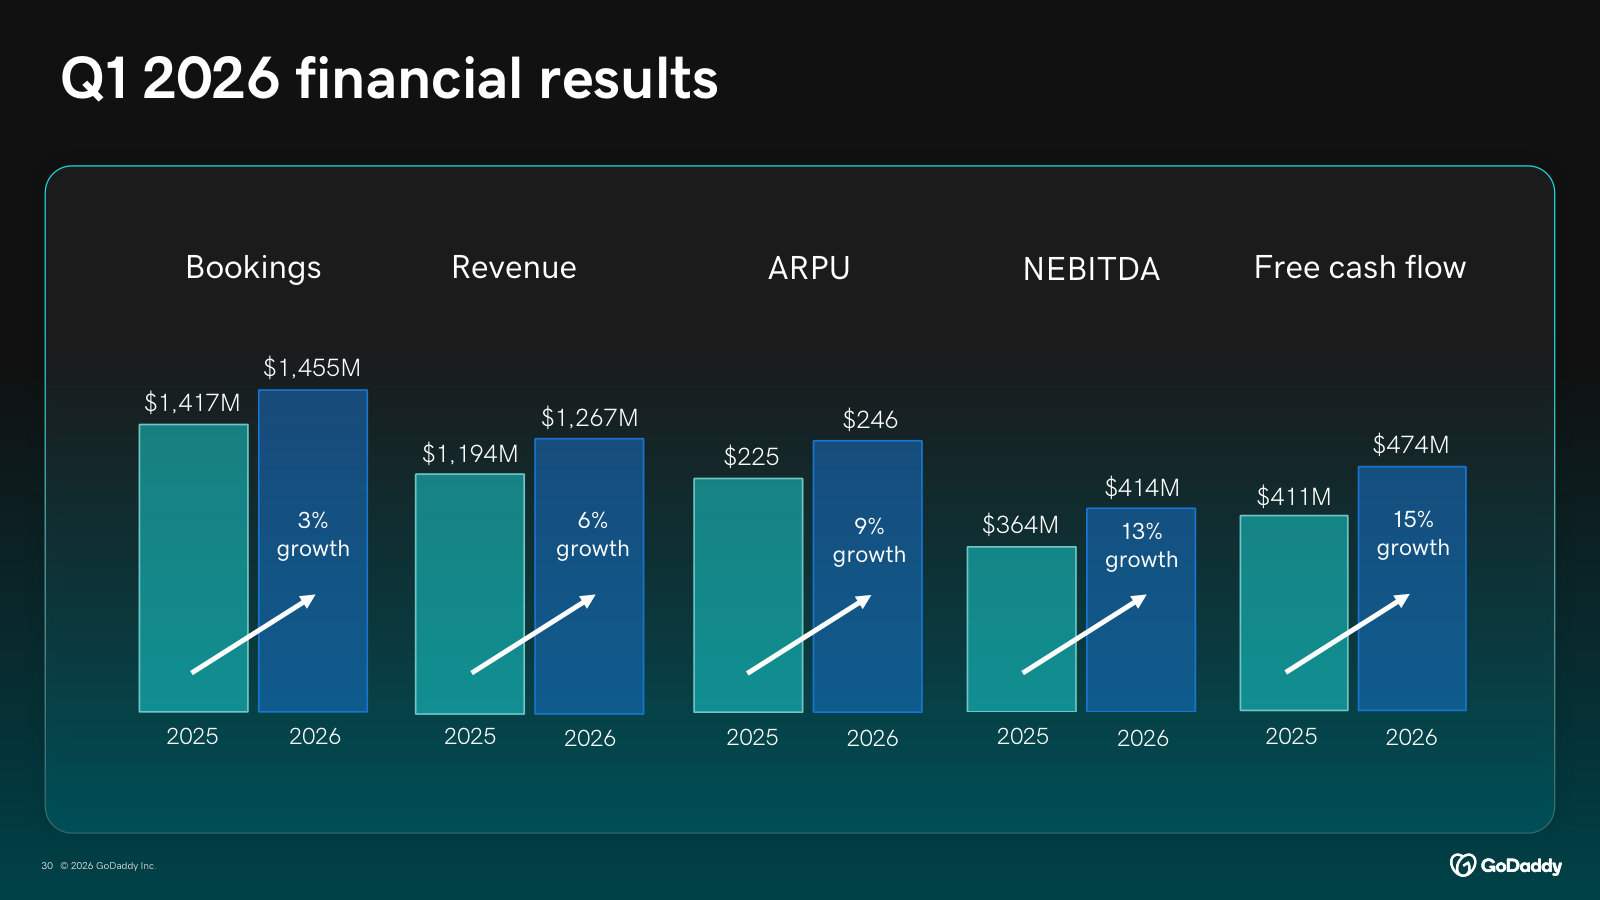
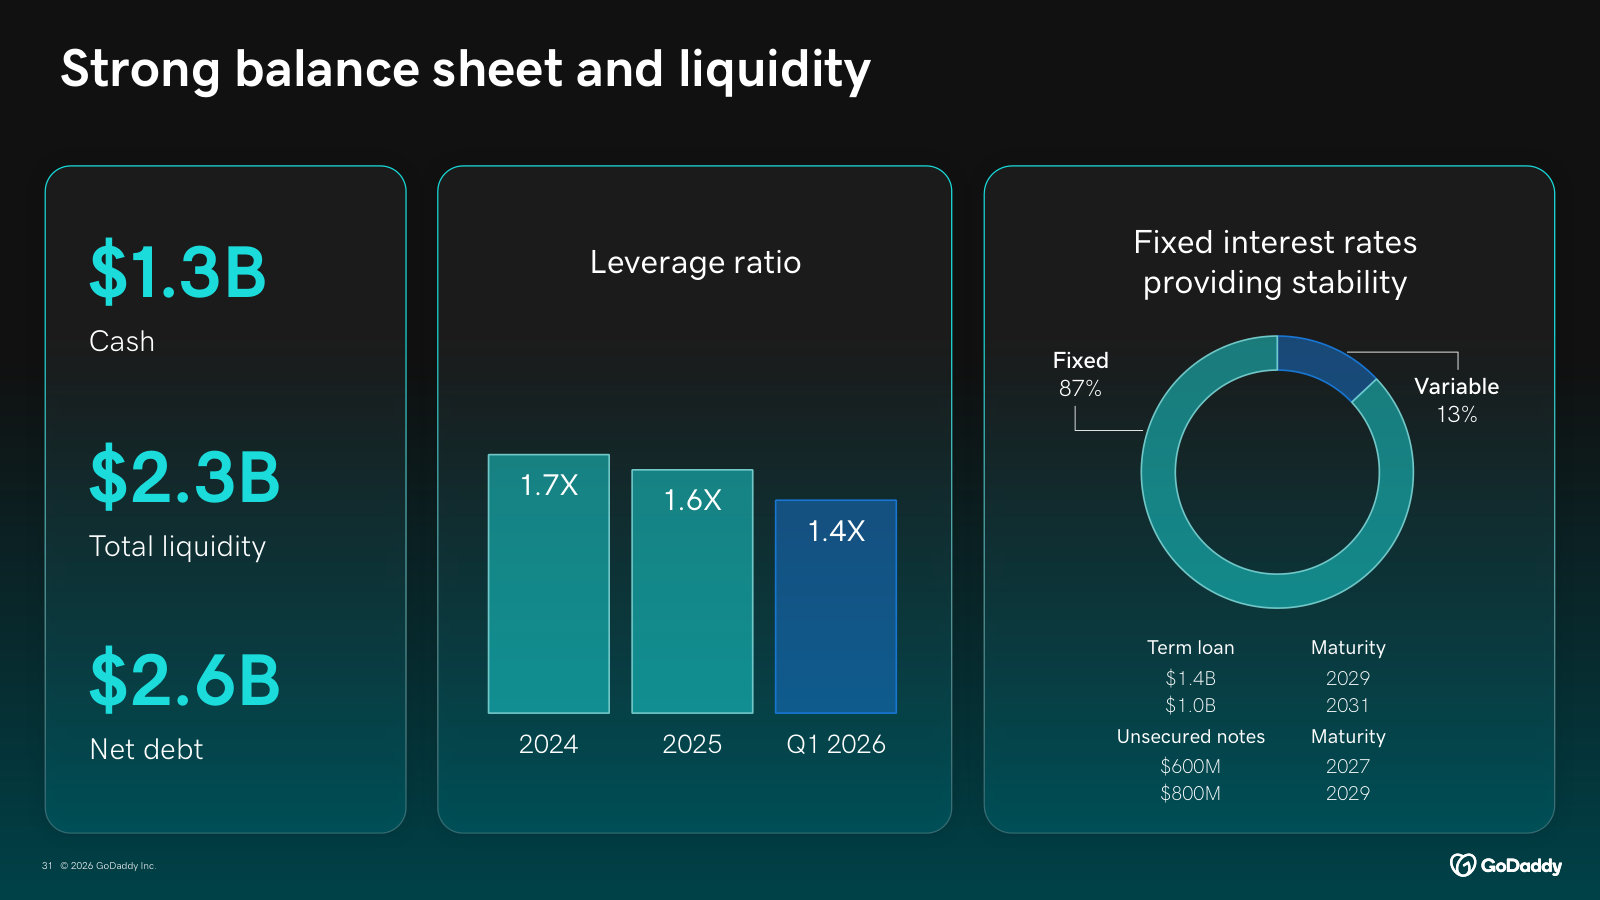
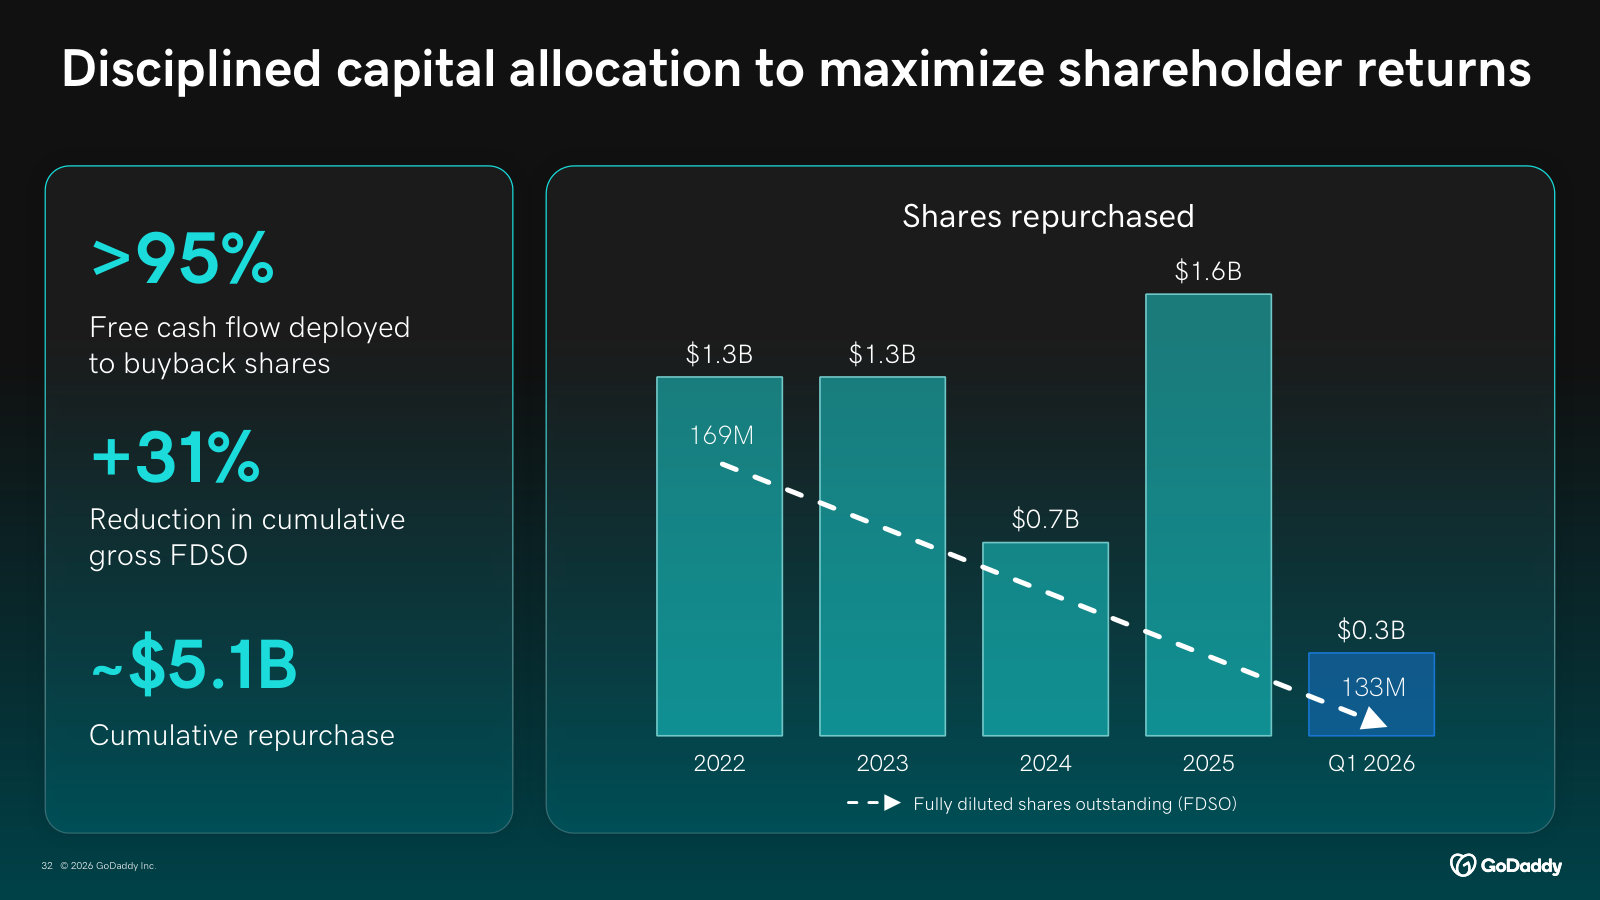
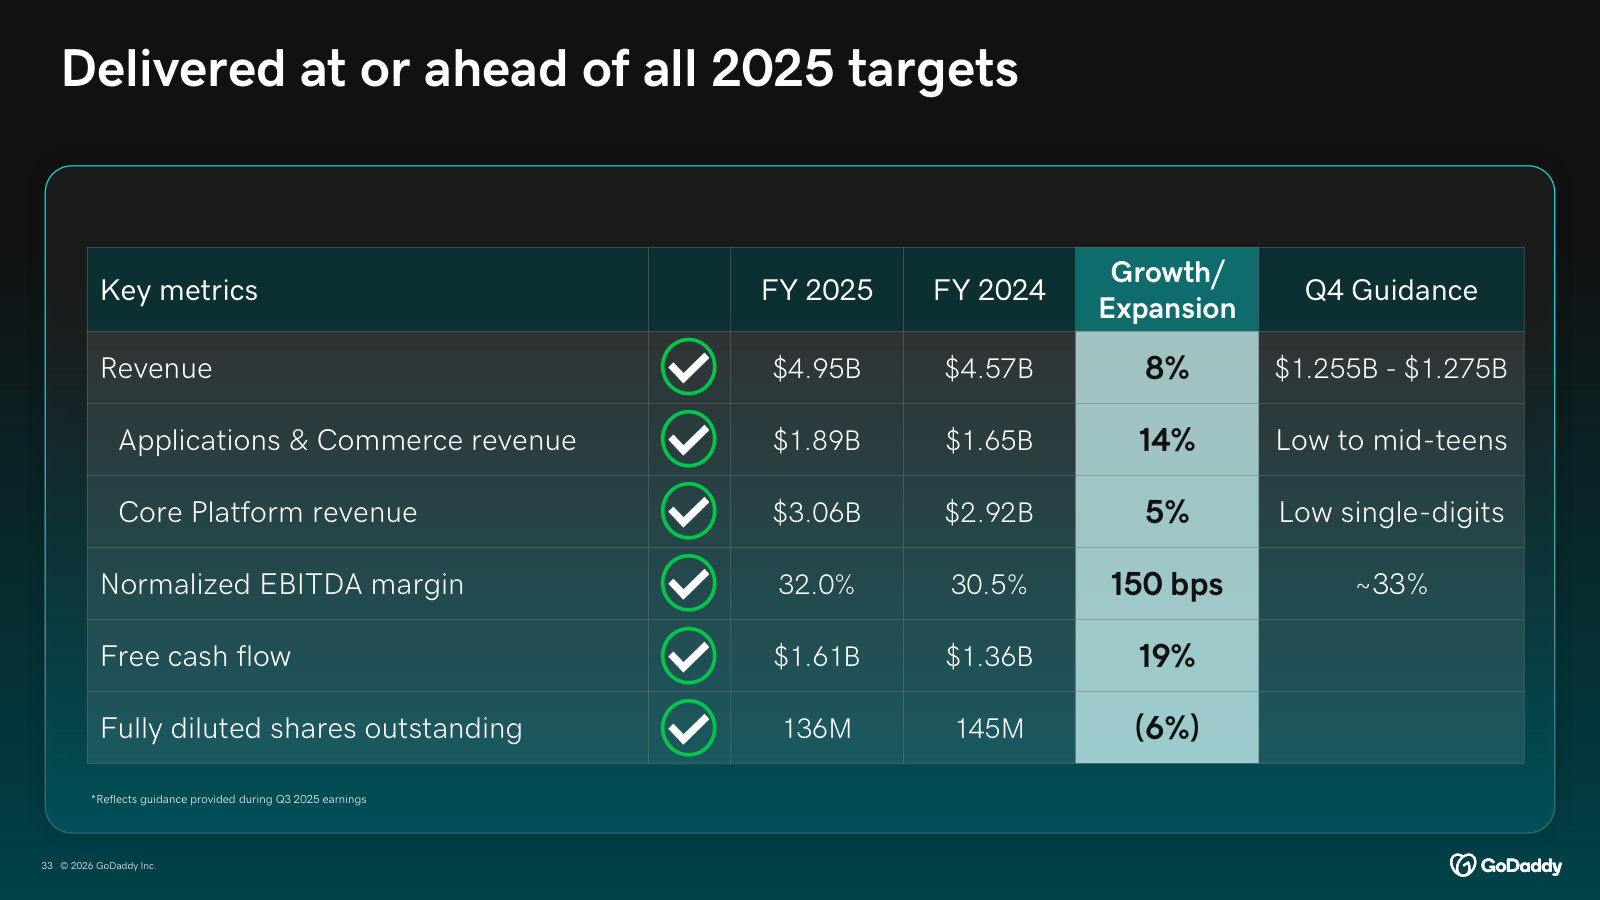
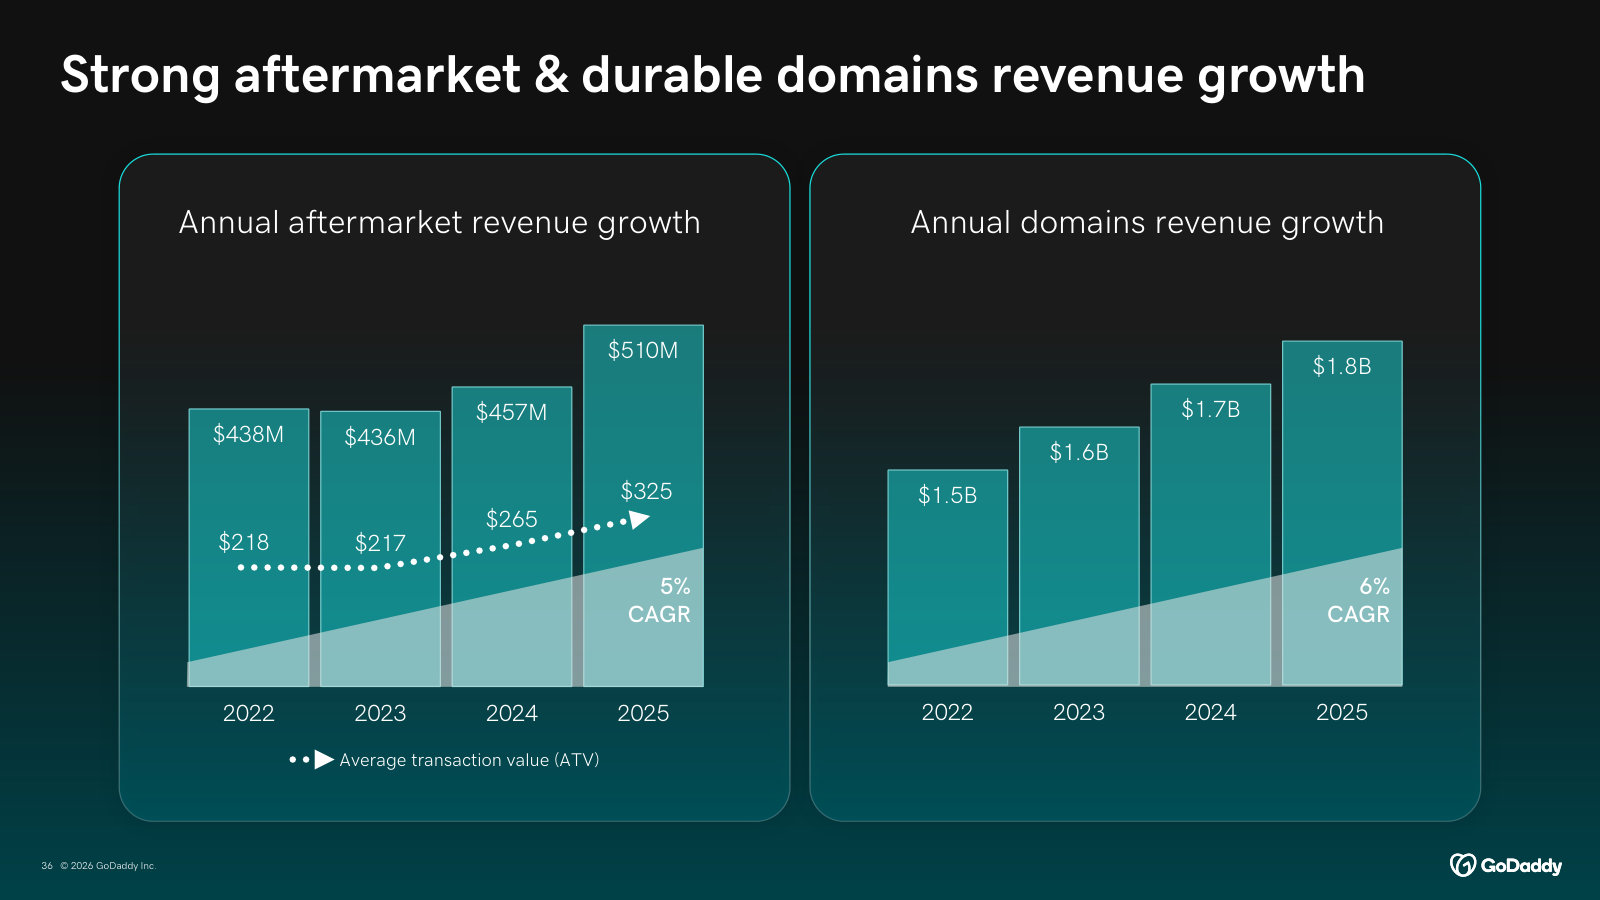
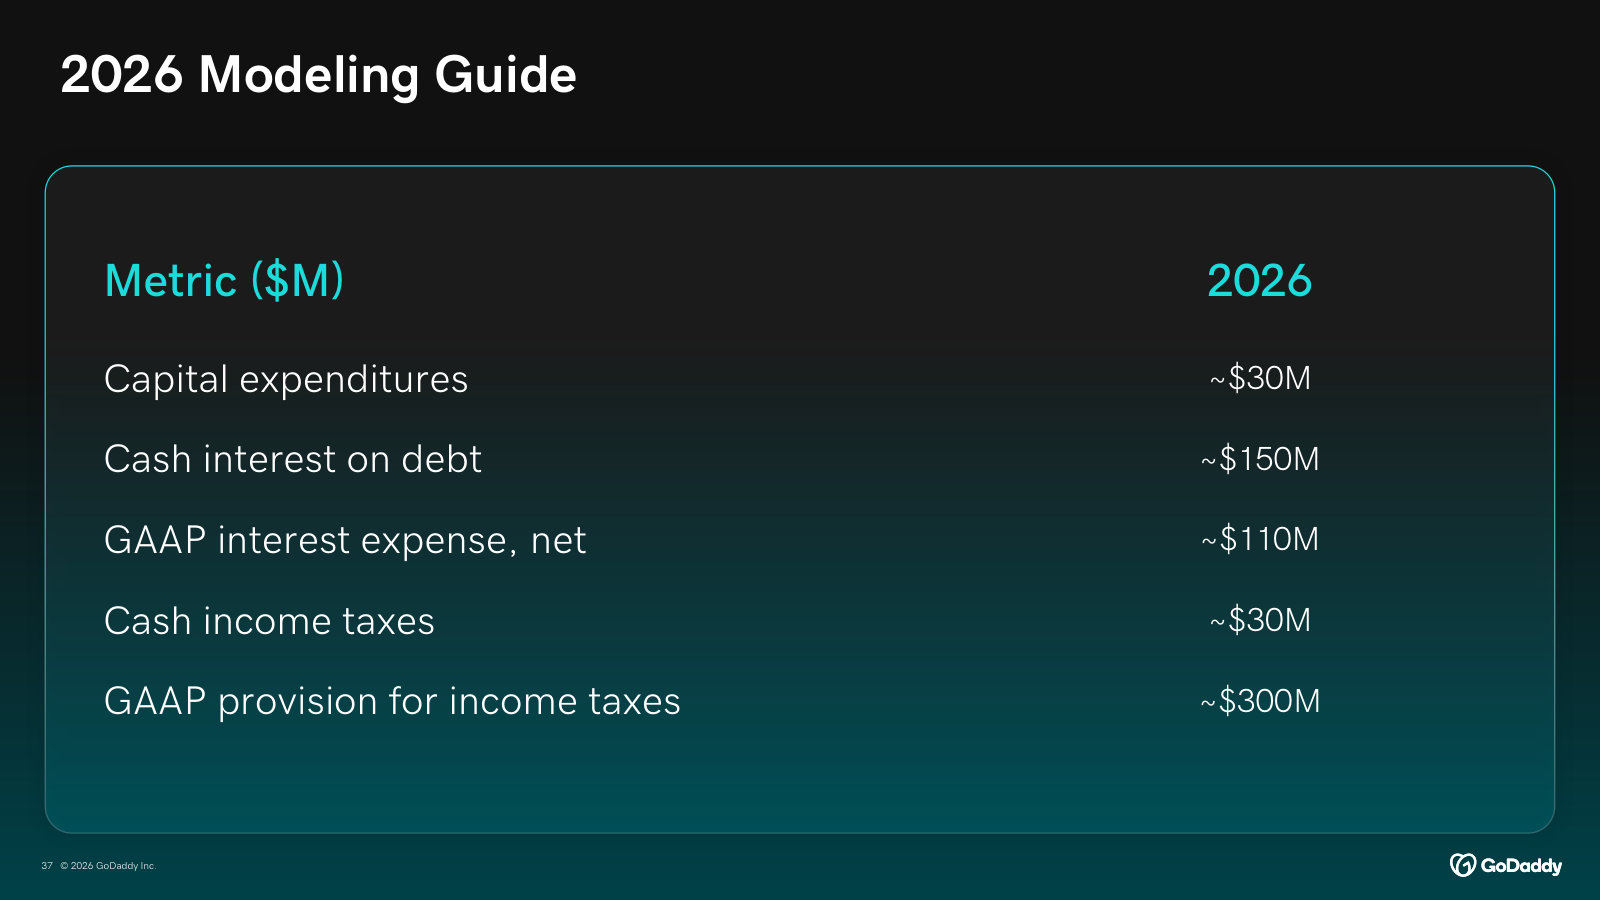
2024 Investor Day — 2024
Management's fullest strategy statement, with segment leaders walking through TAM, unit economics, international, marketing efficiency and segment-level financials — the depth the quarterly overview leaves out, plus the three-year targets GoDaddy is now measured against. · Open the full document →
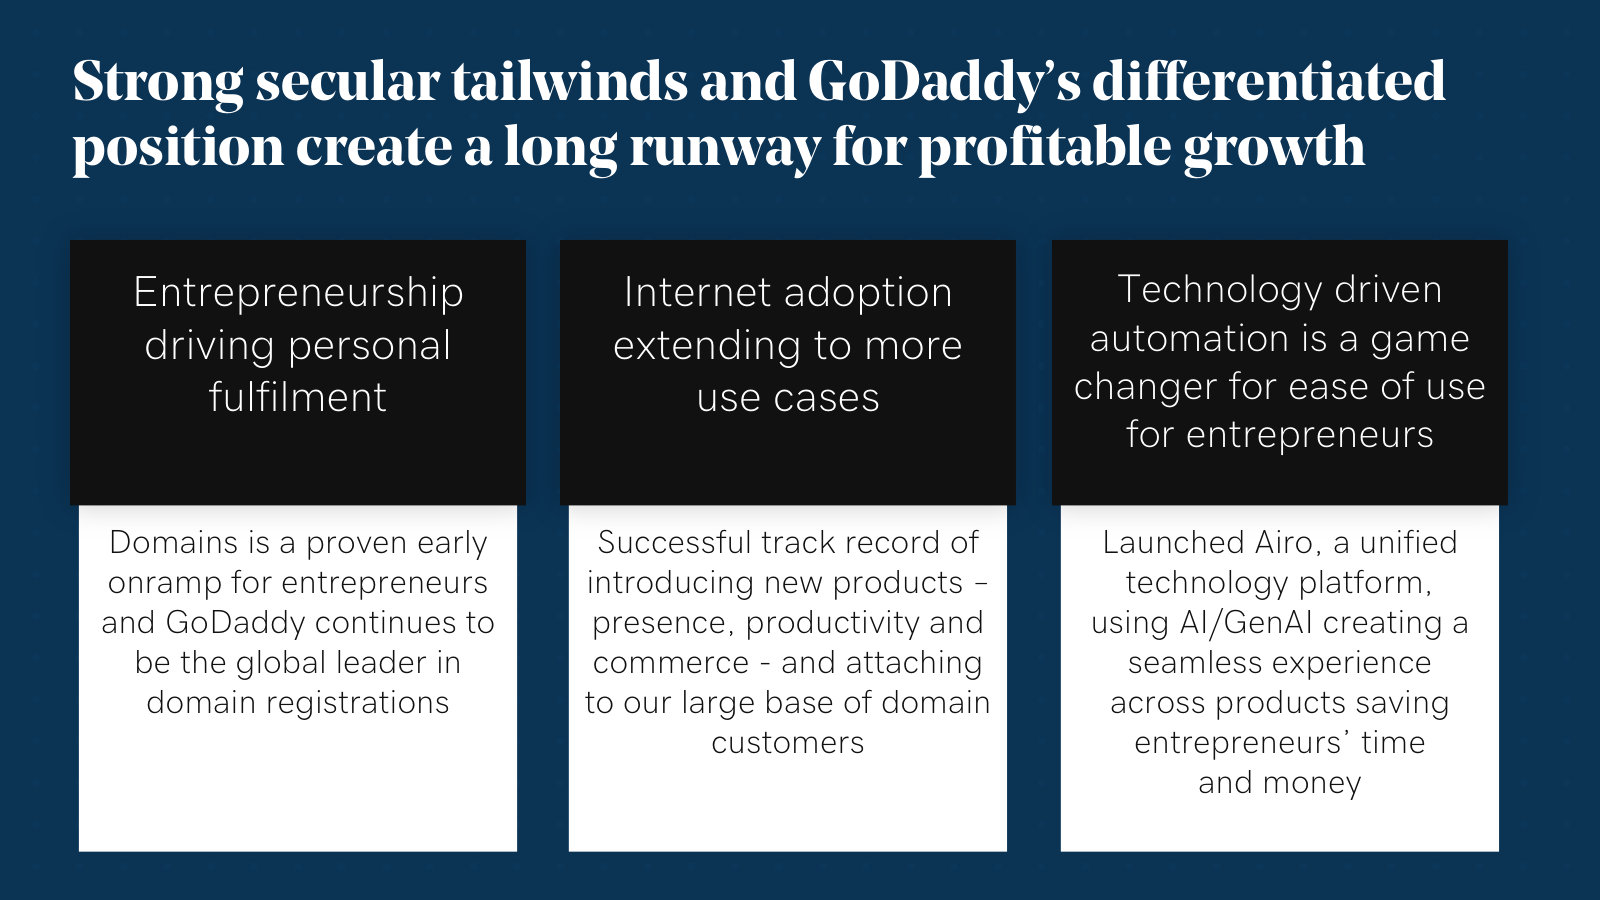
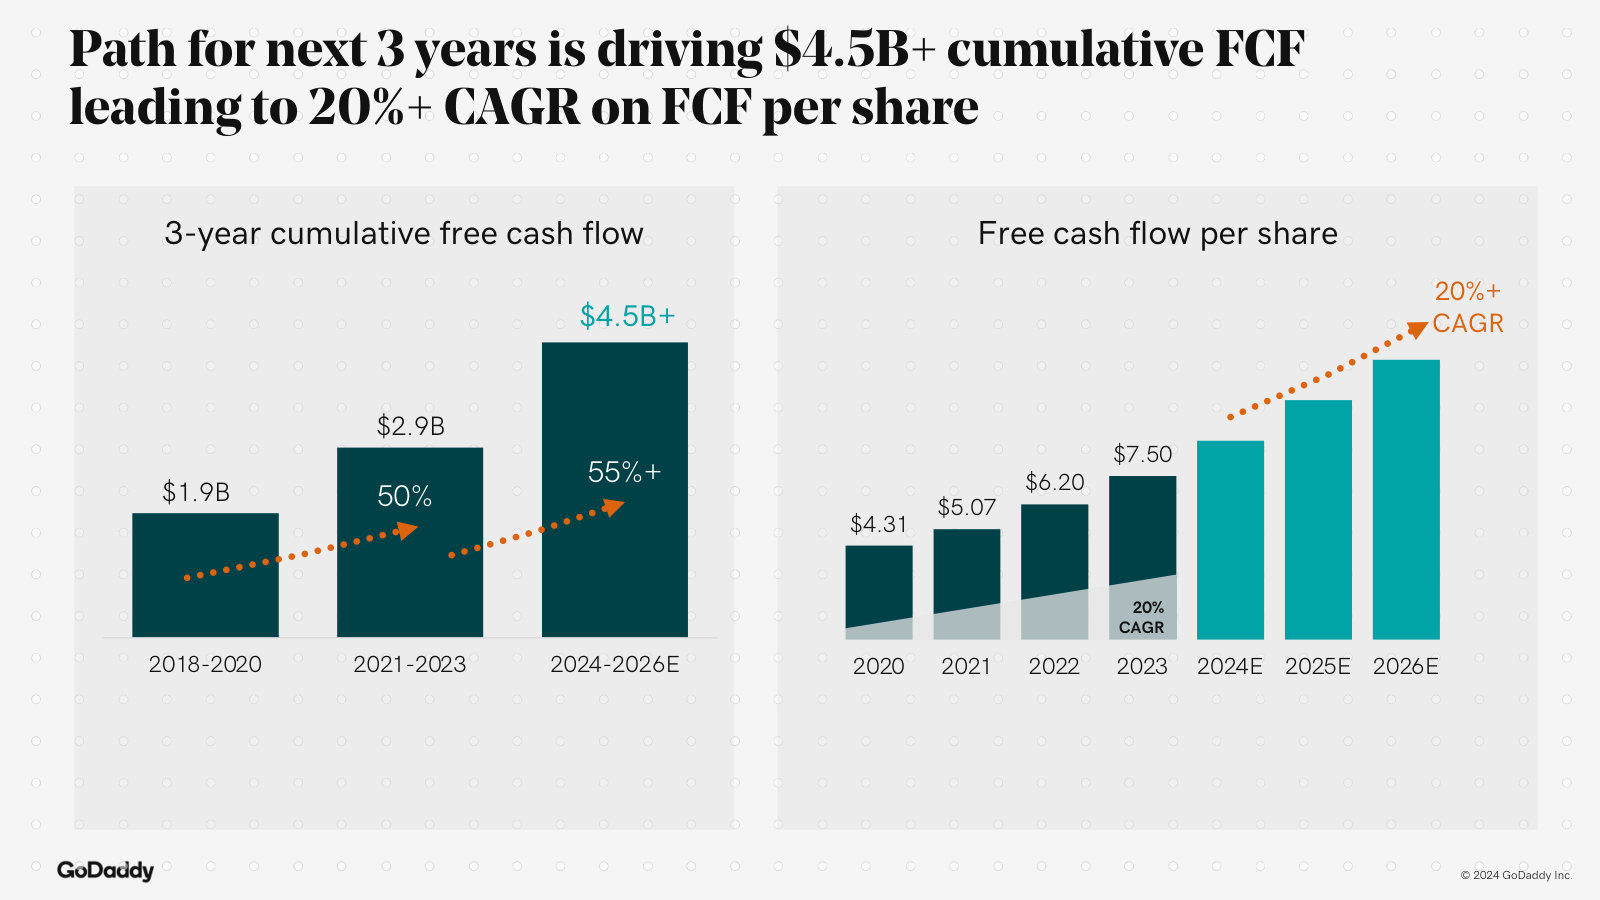
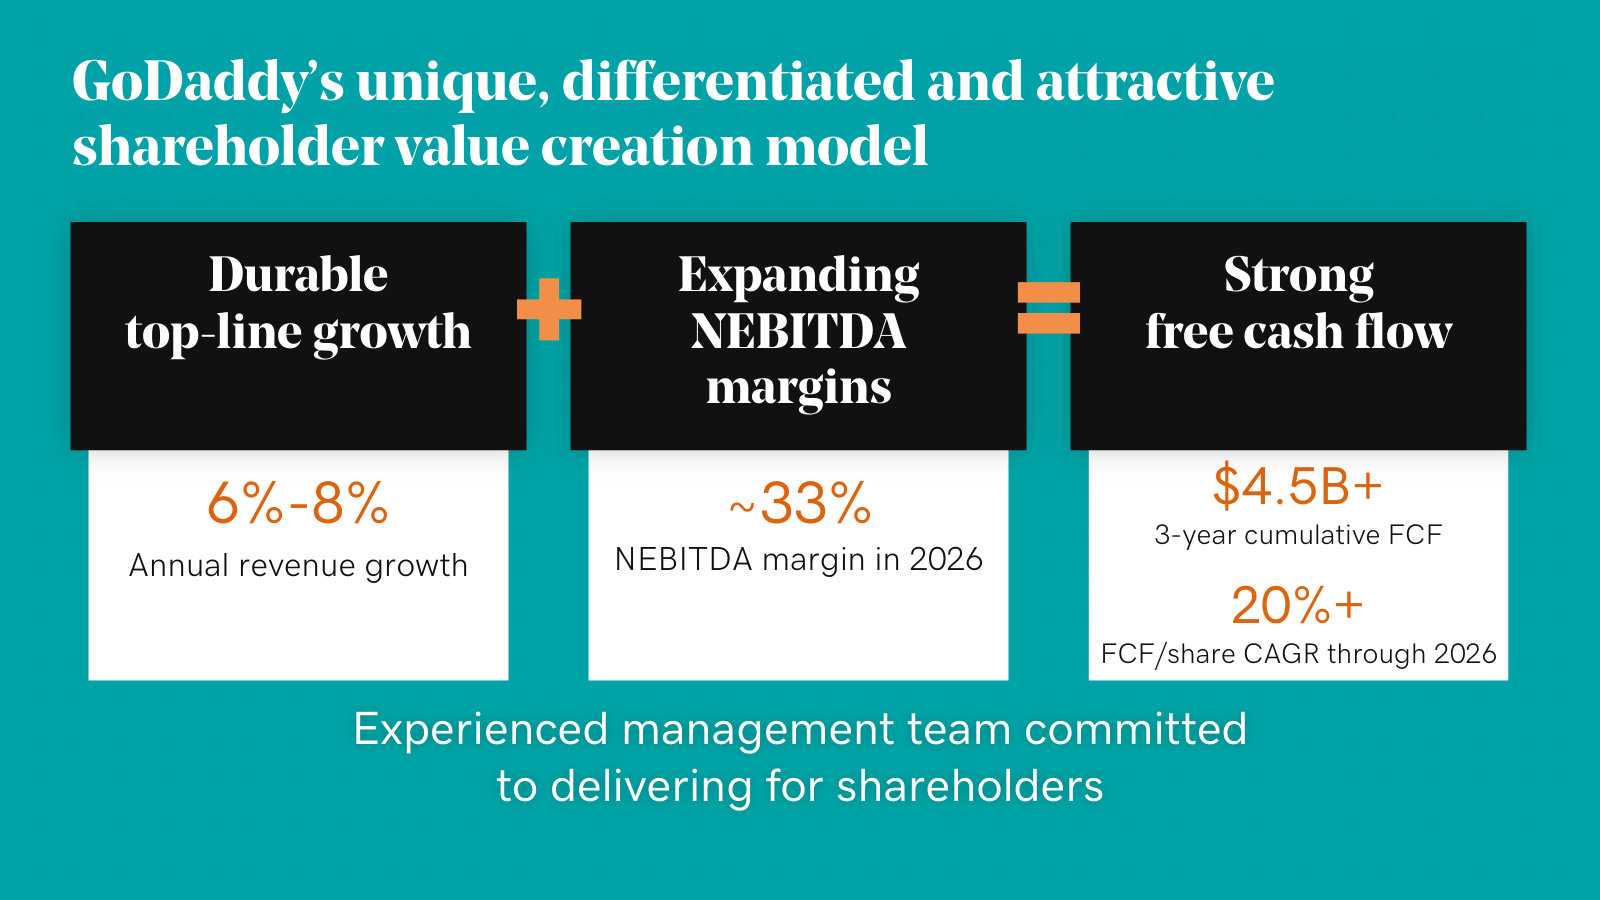
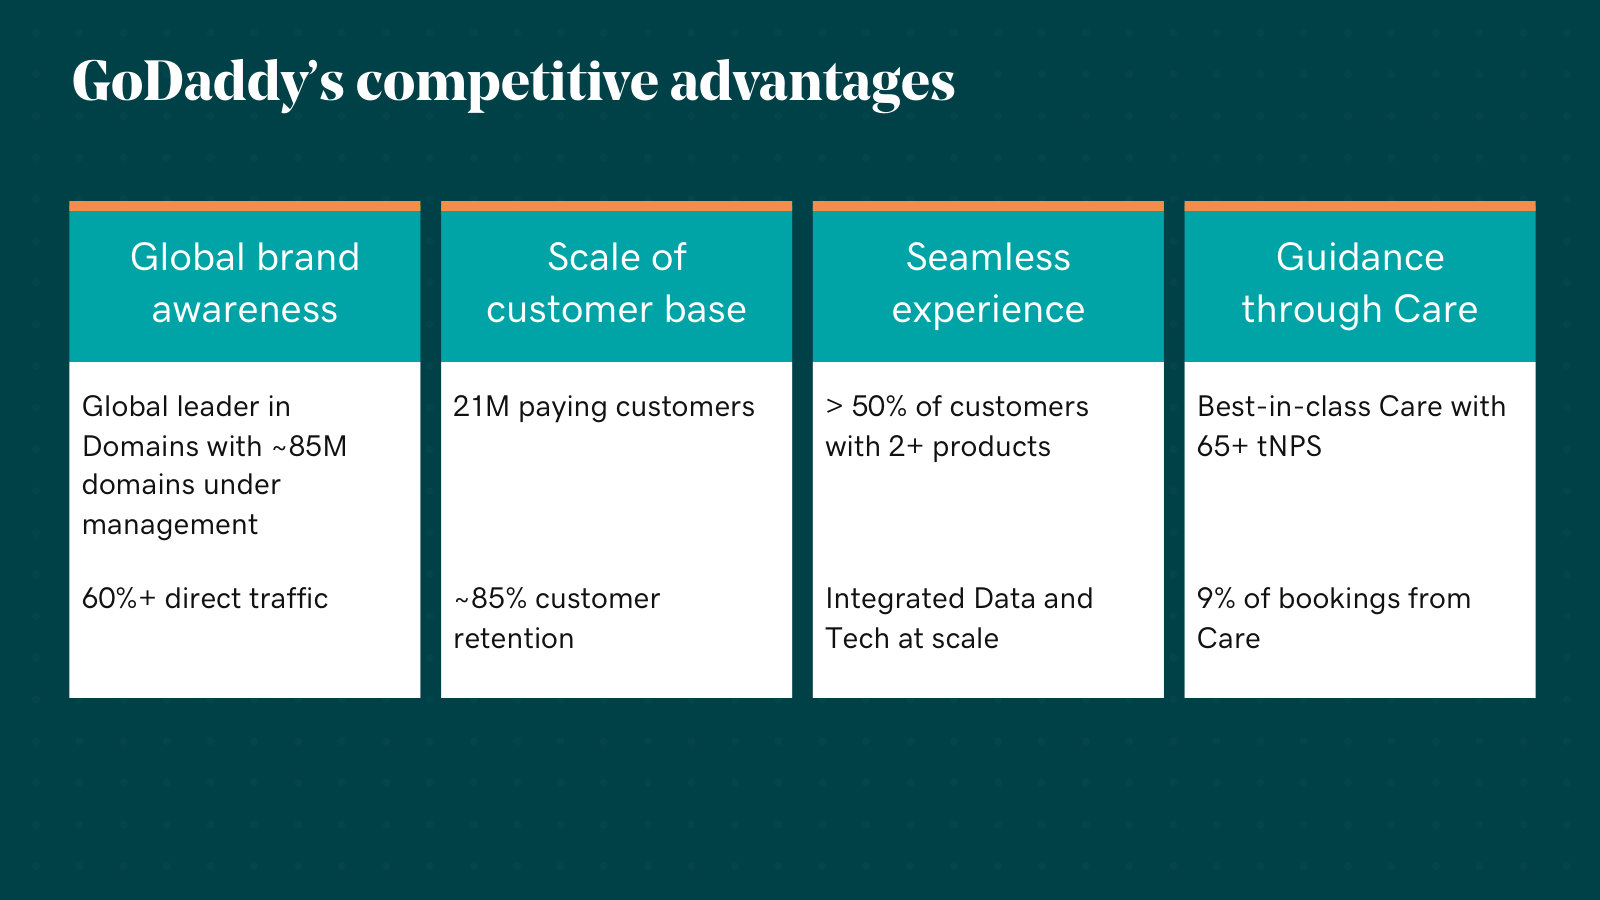
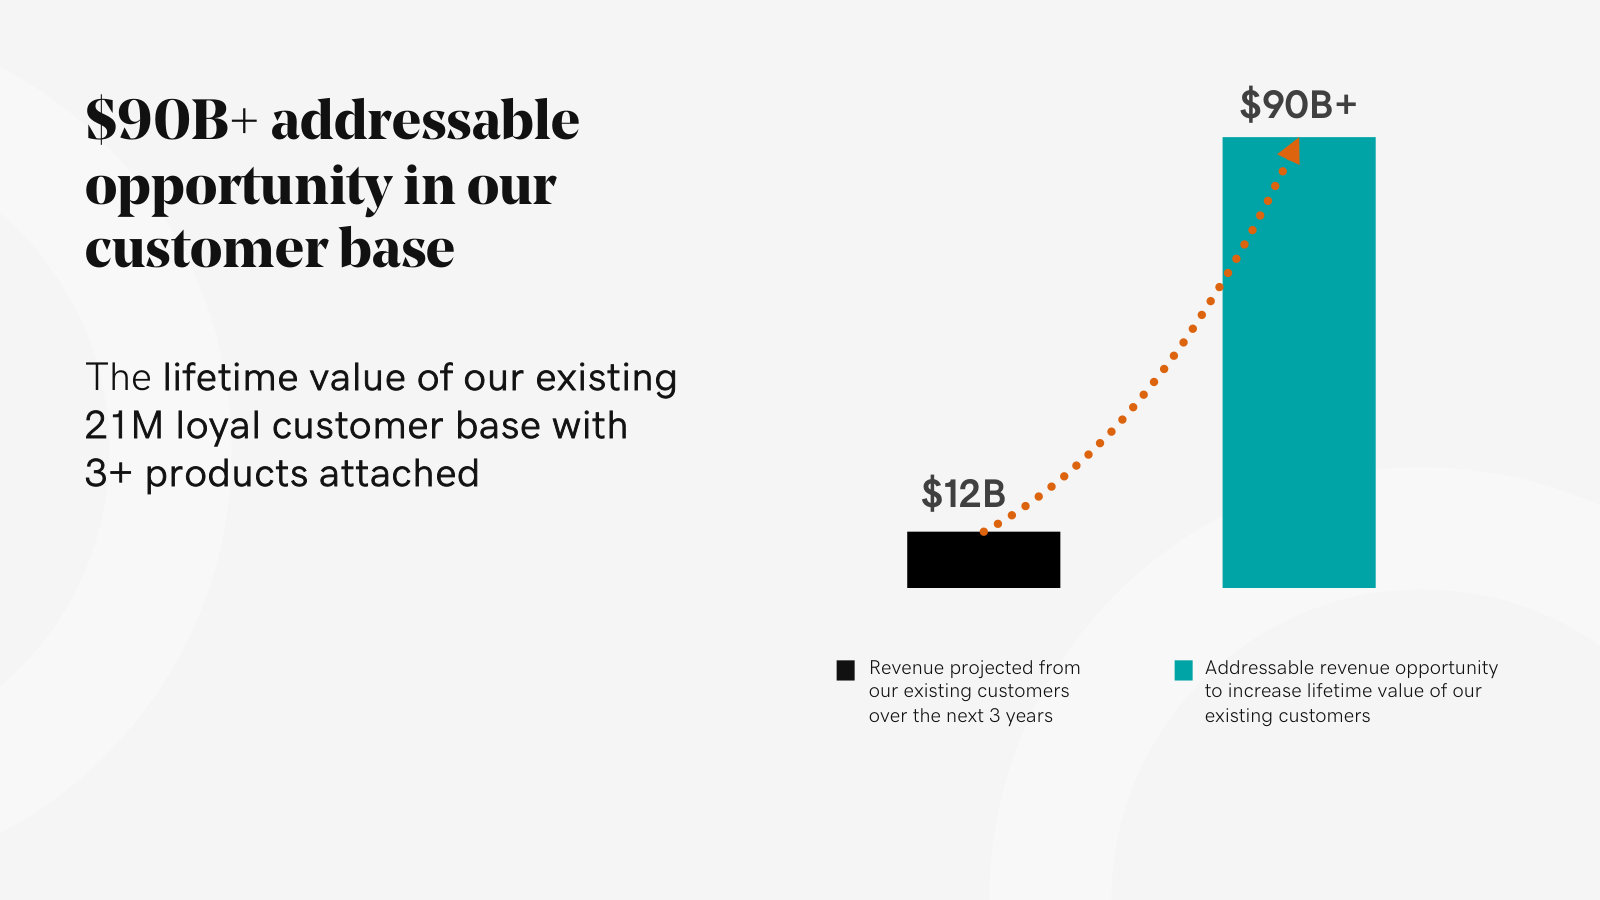
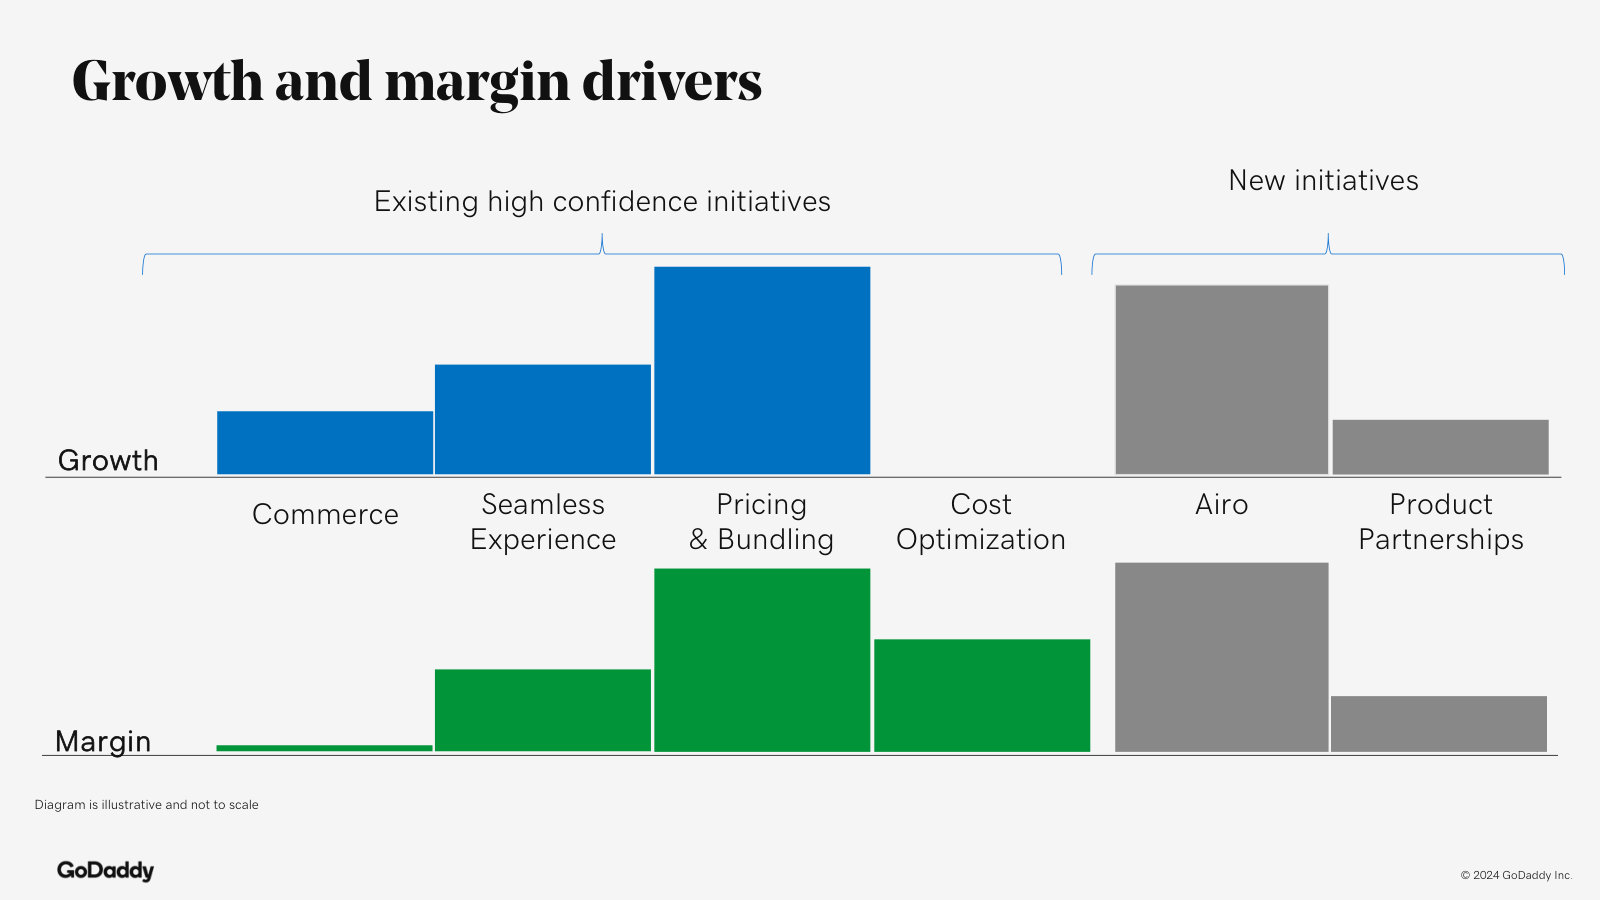
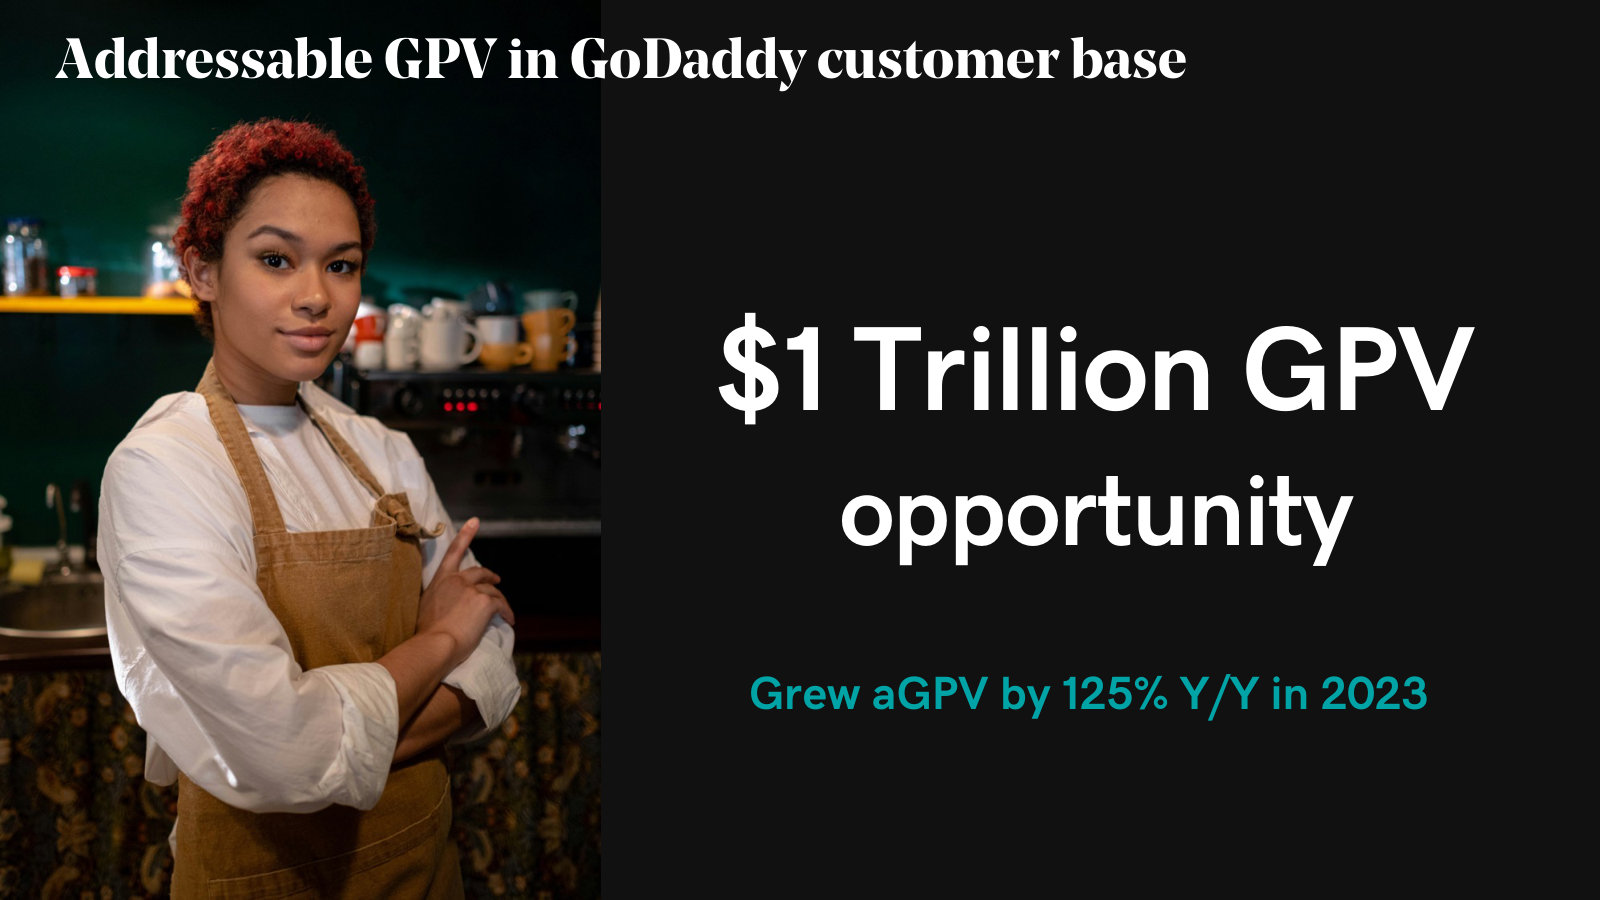
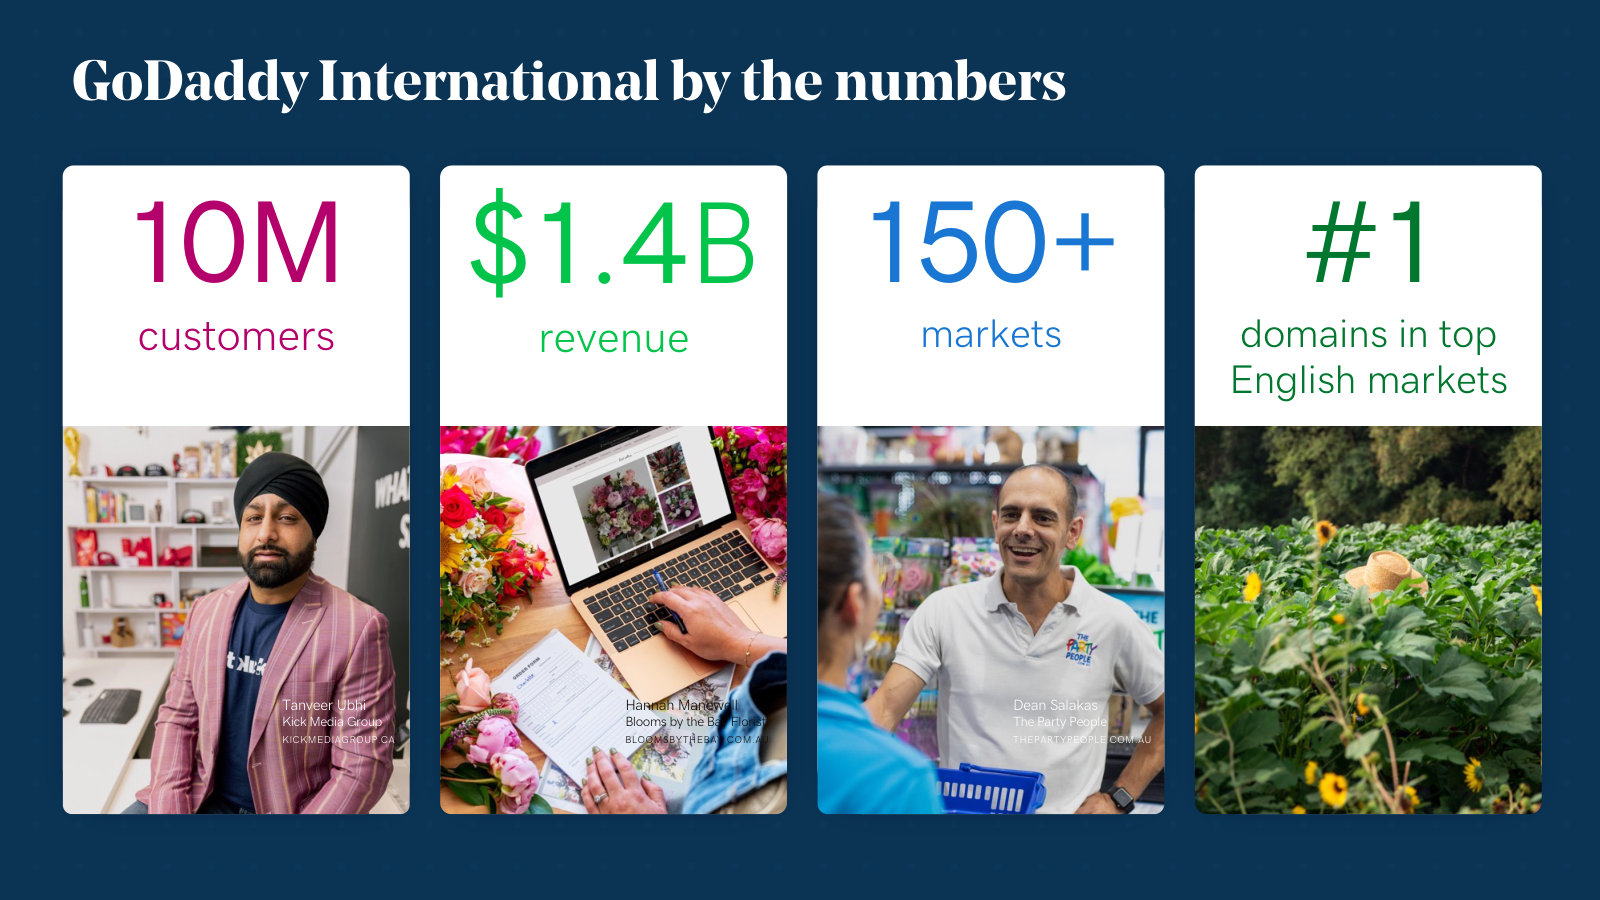
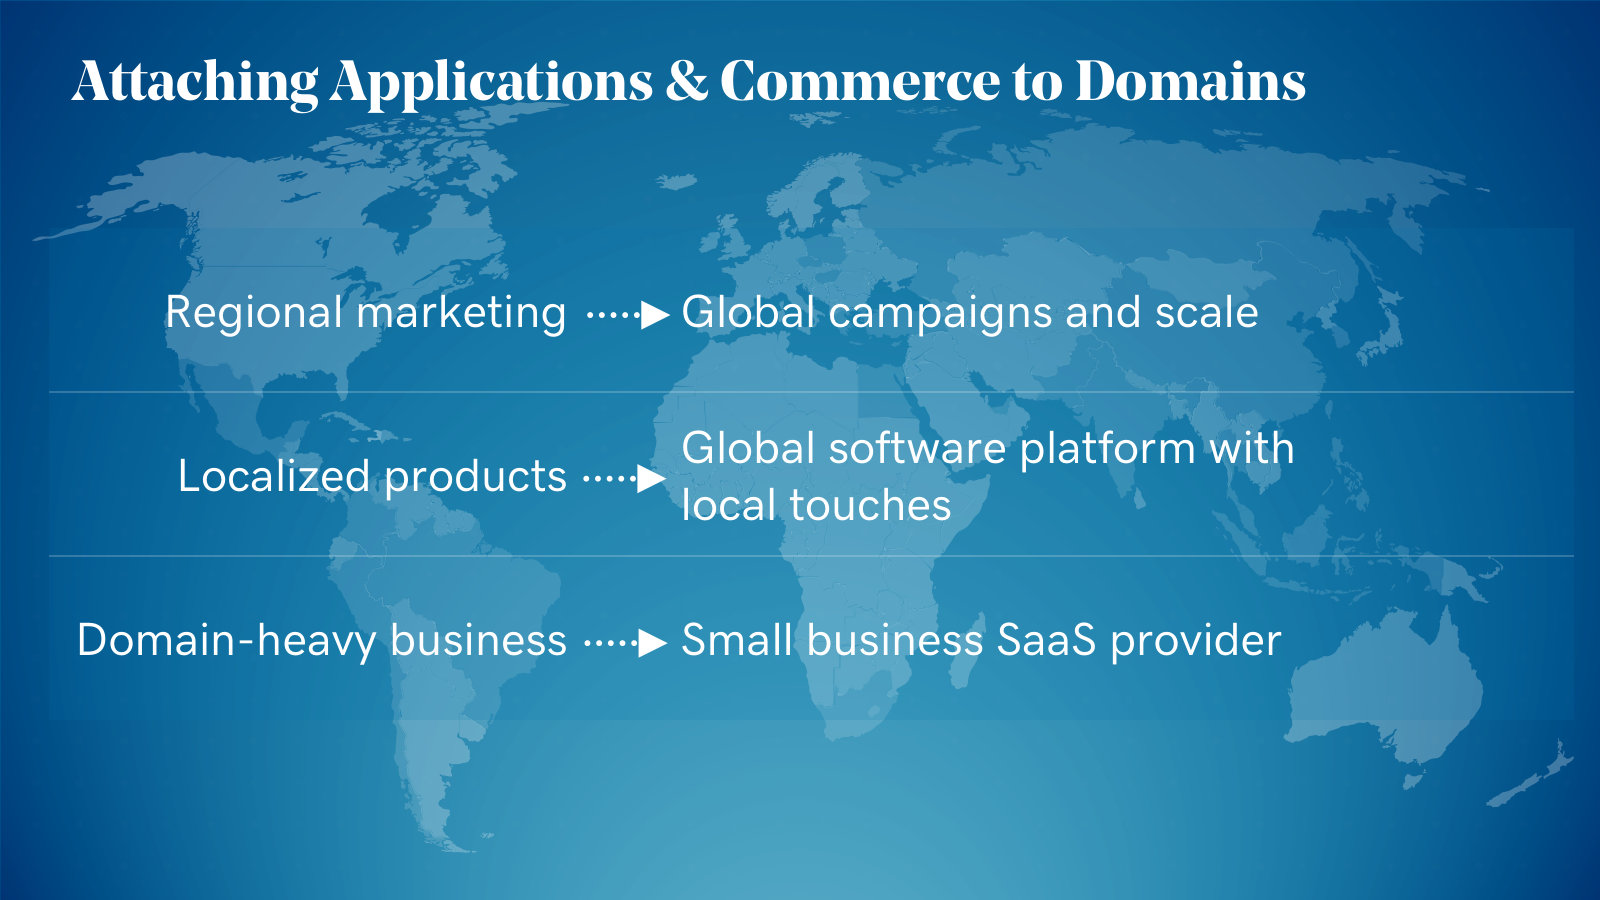
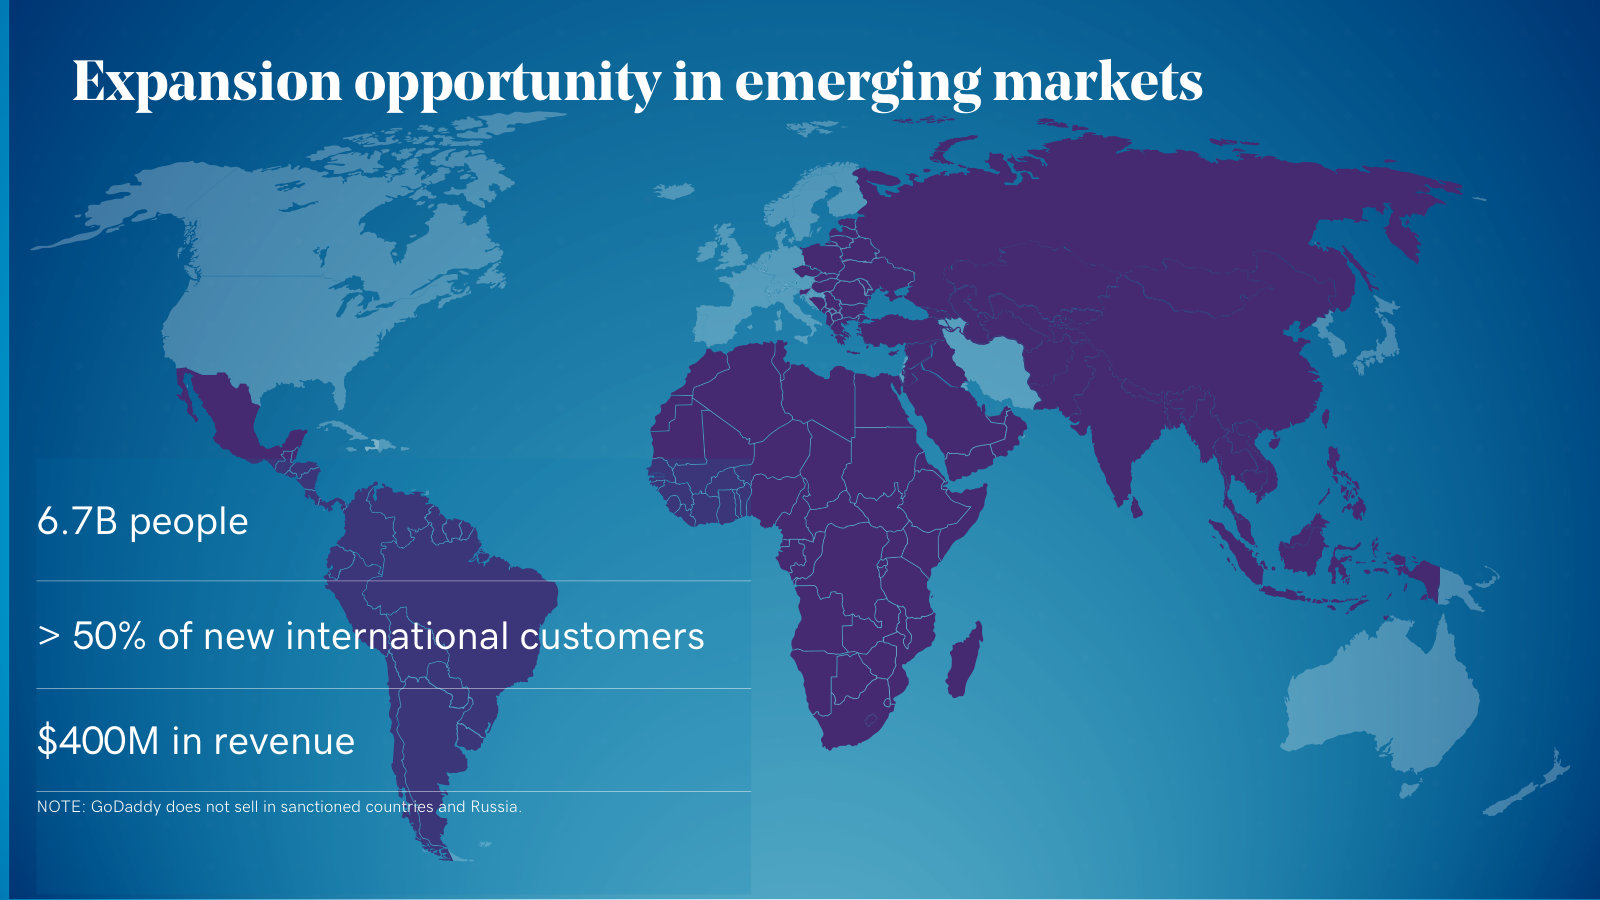
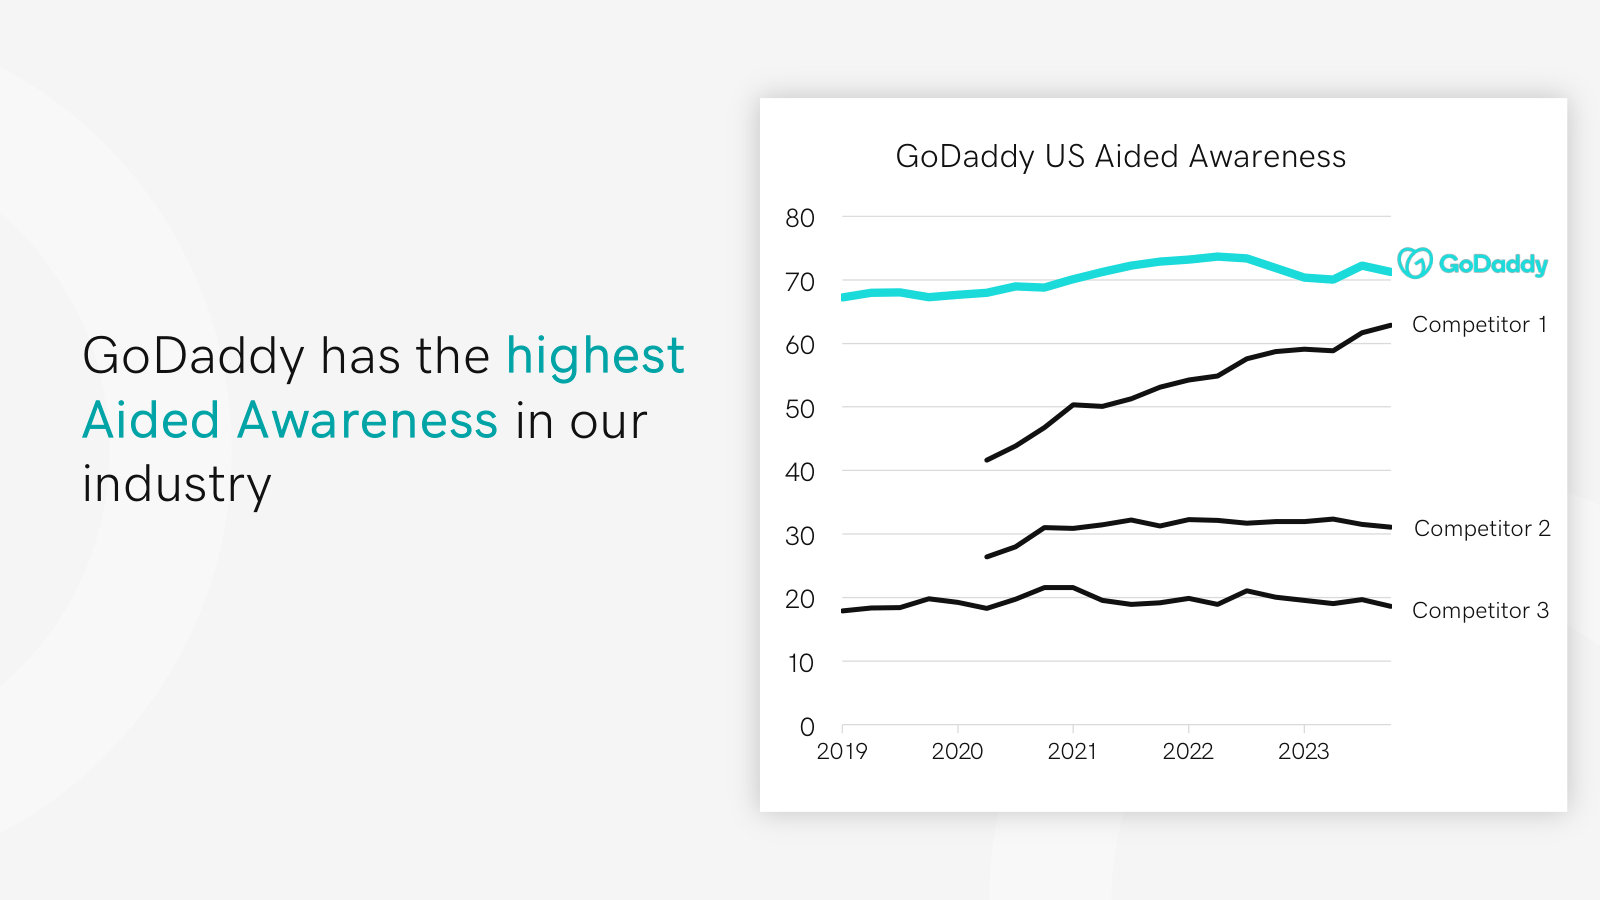
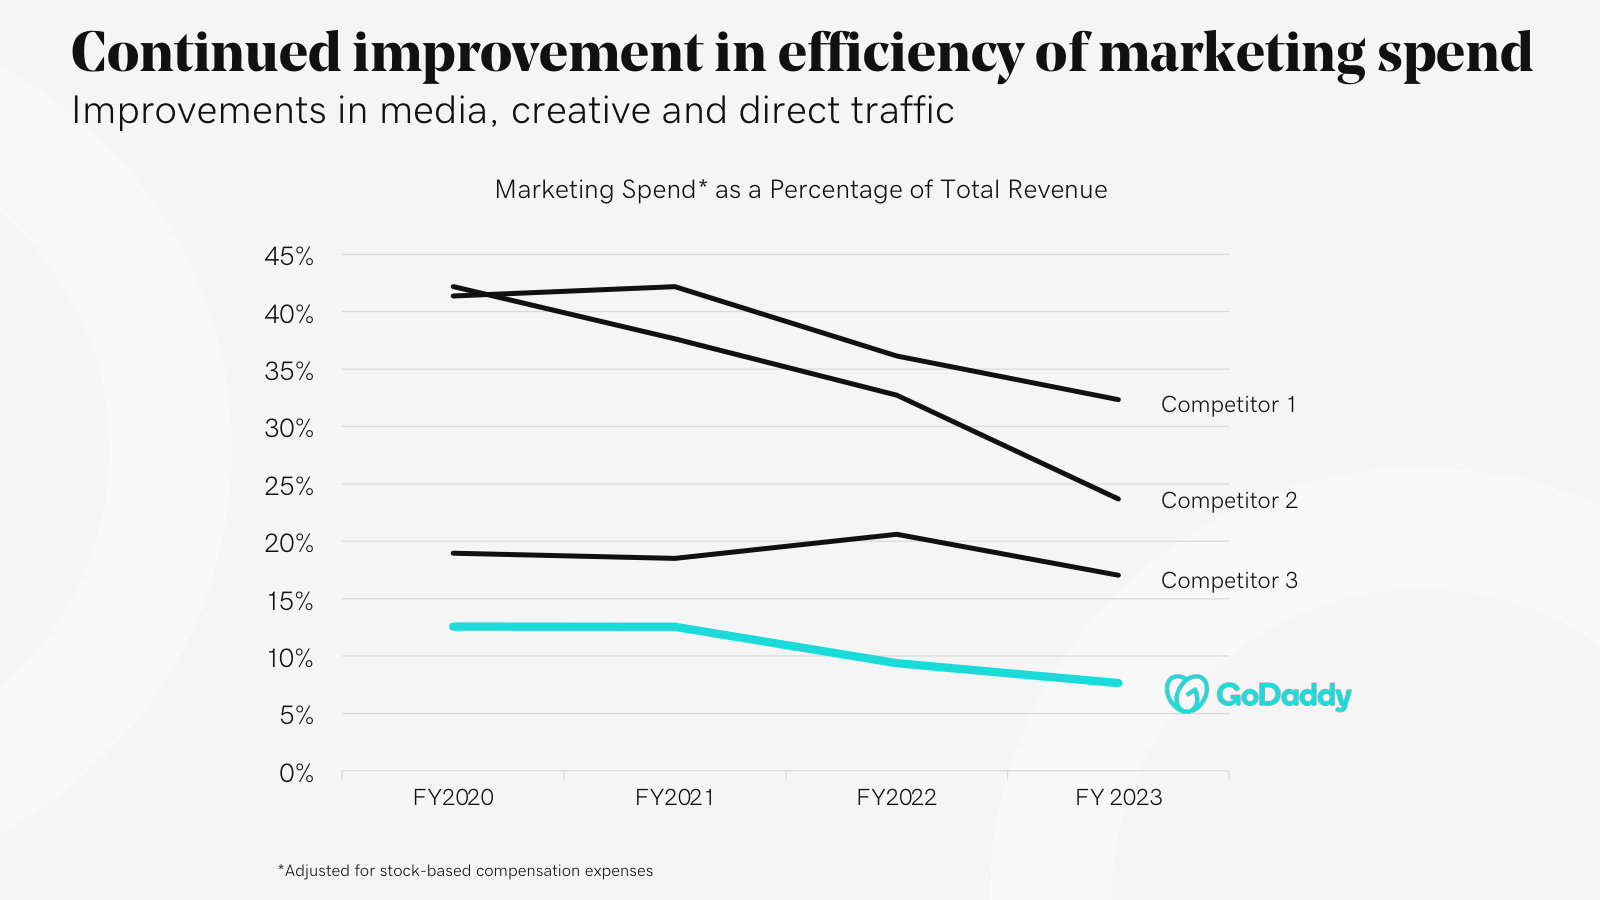
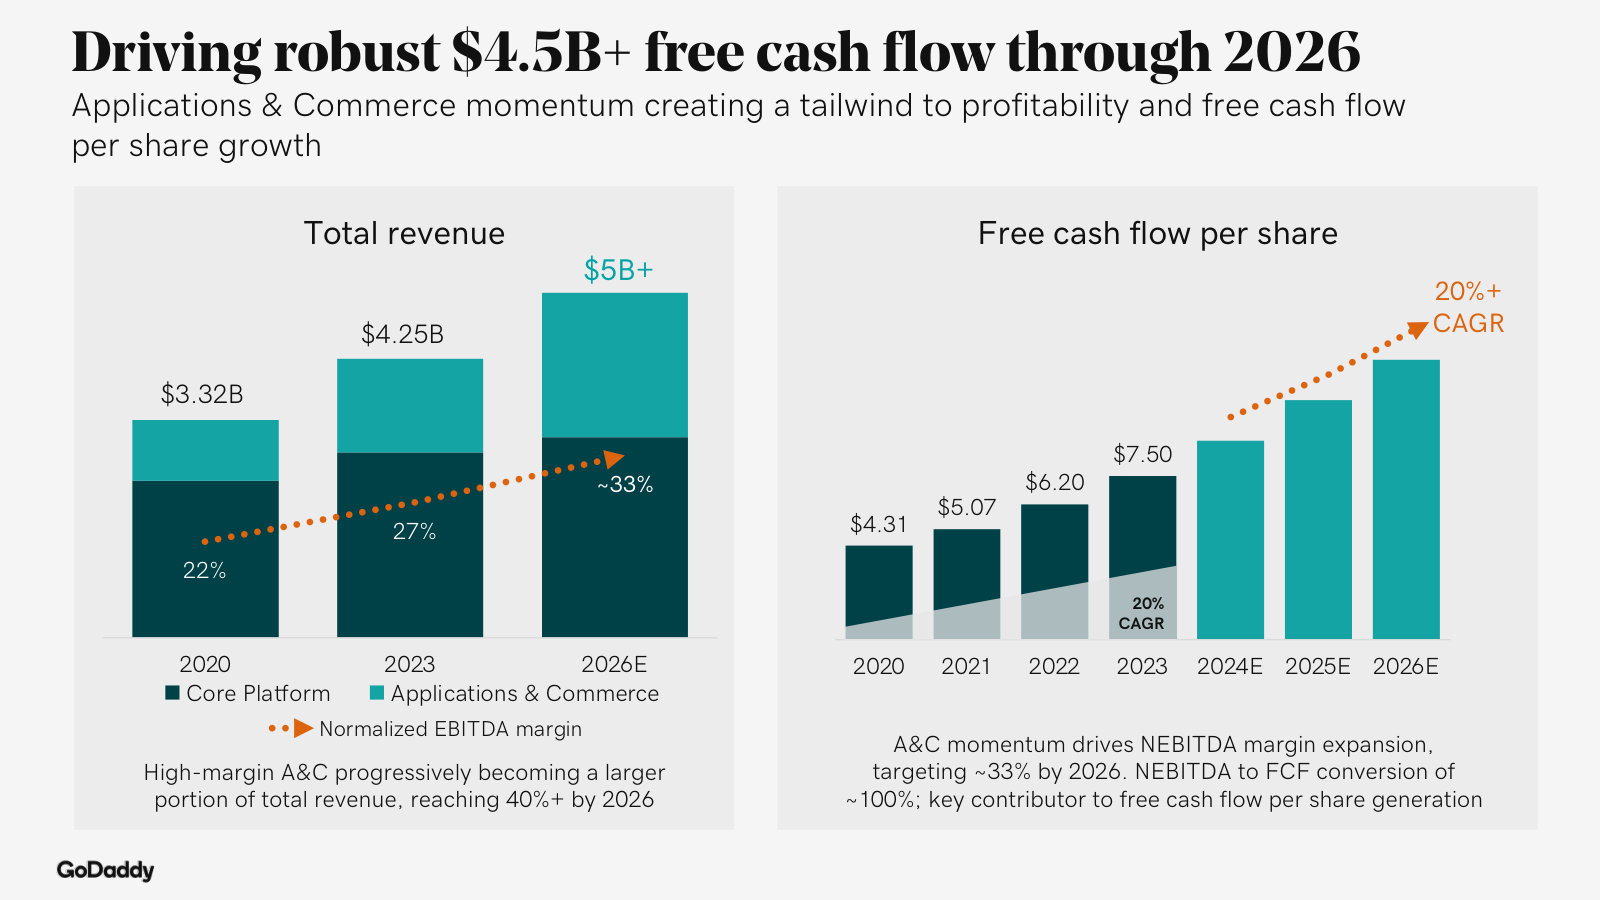
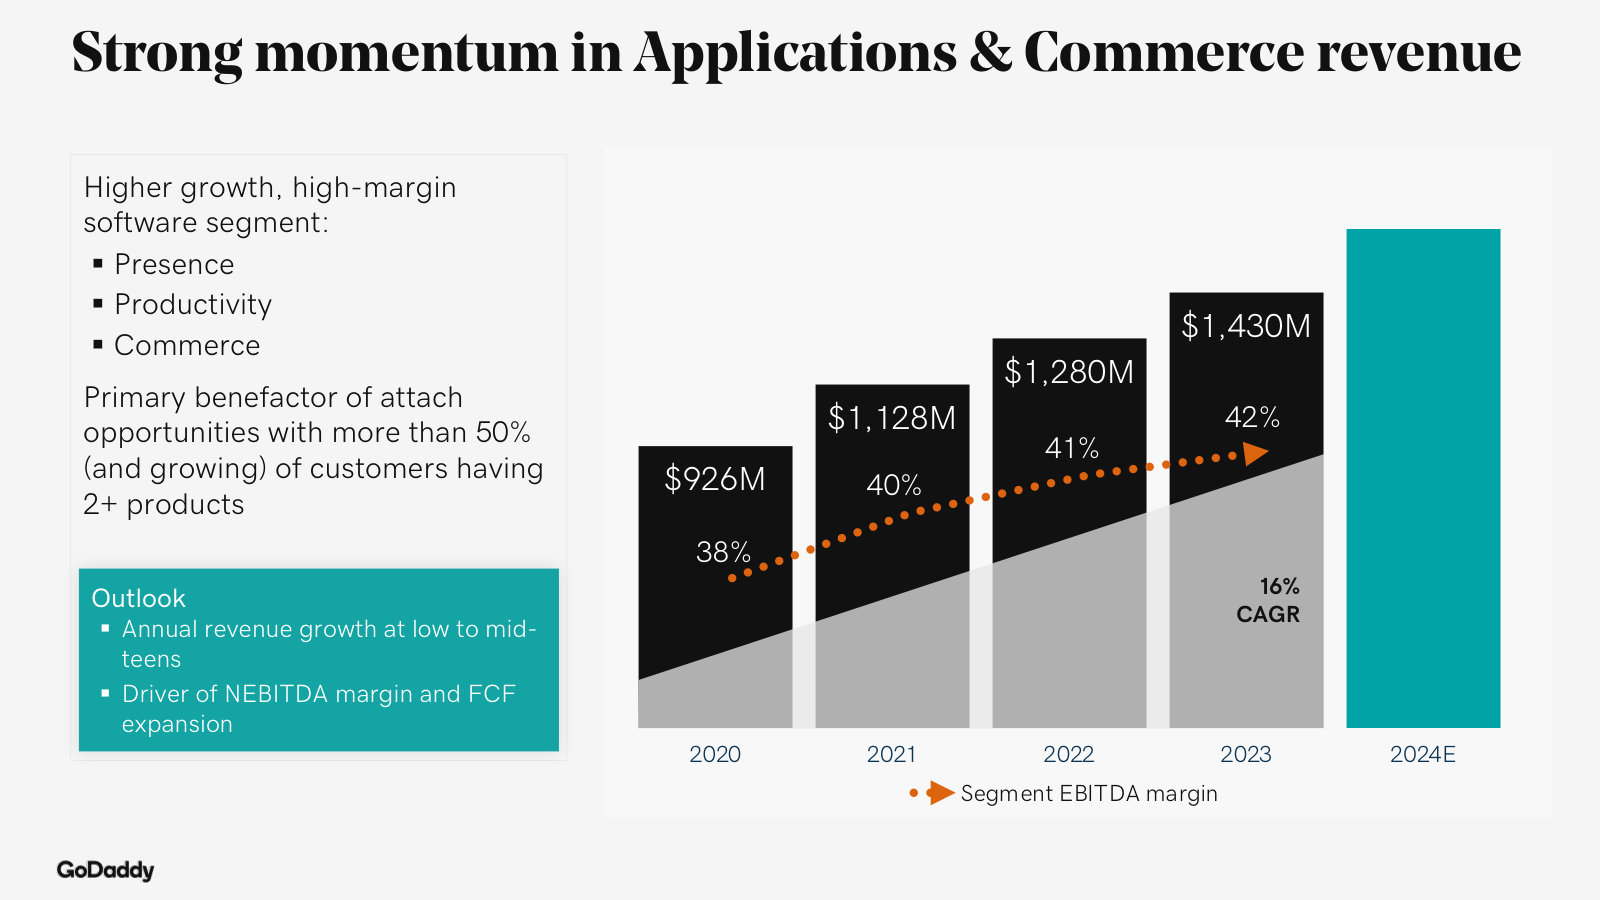
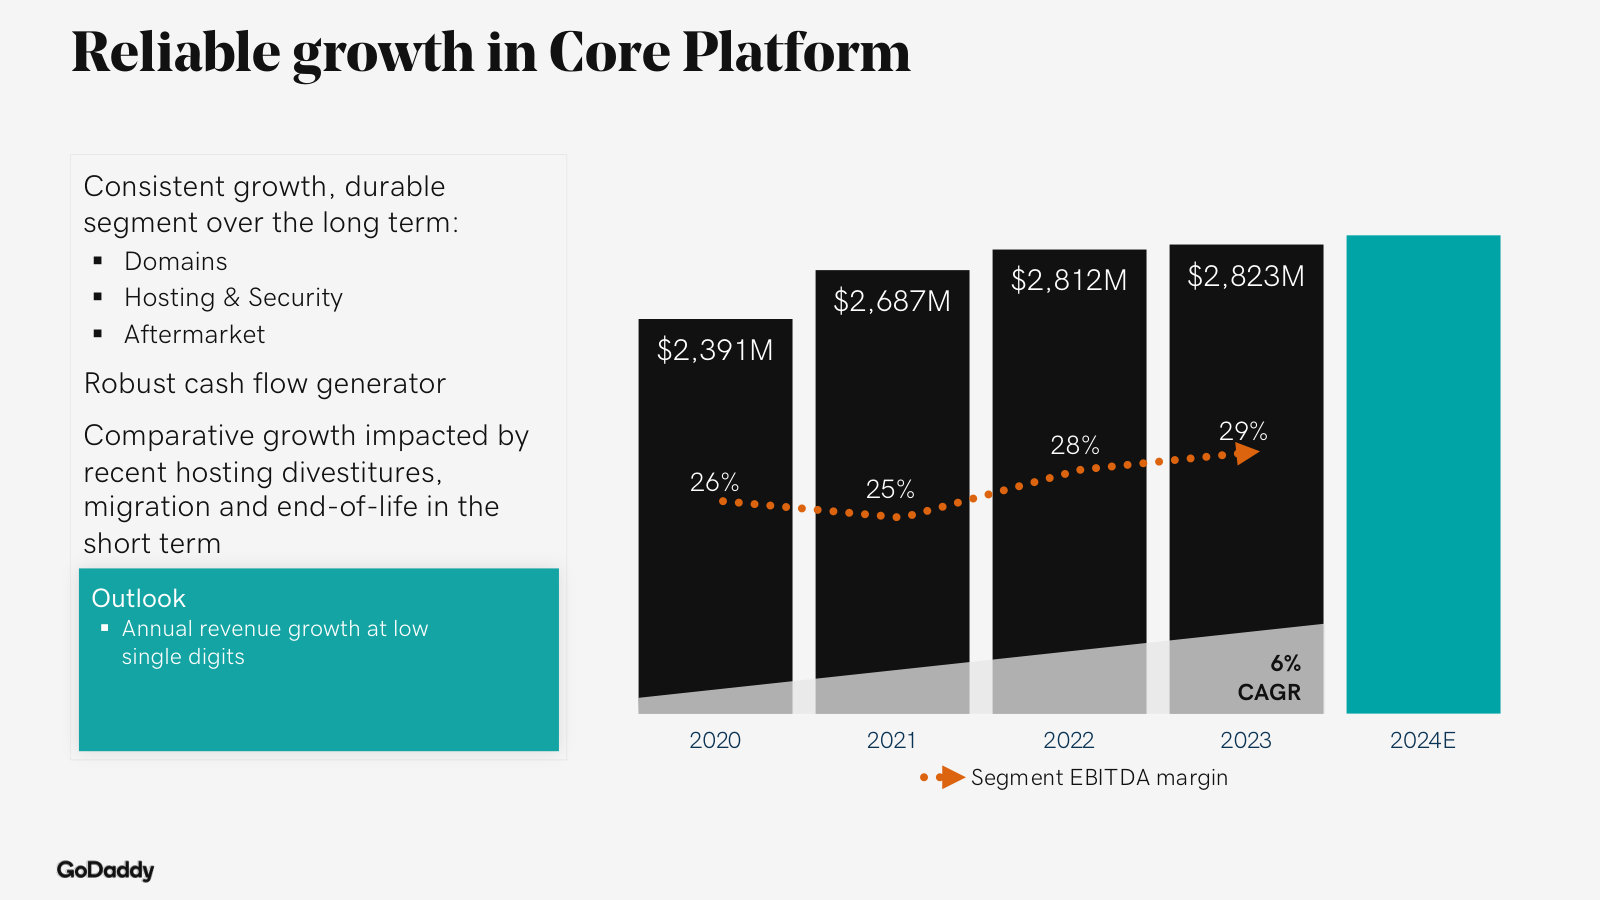
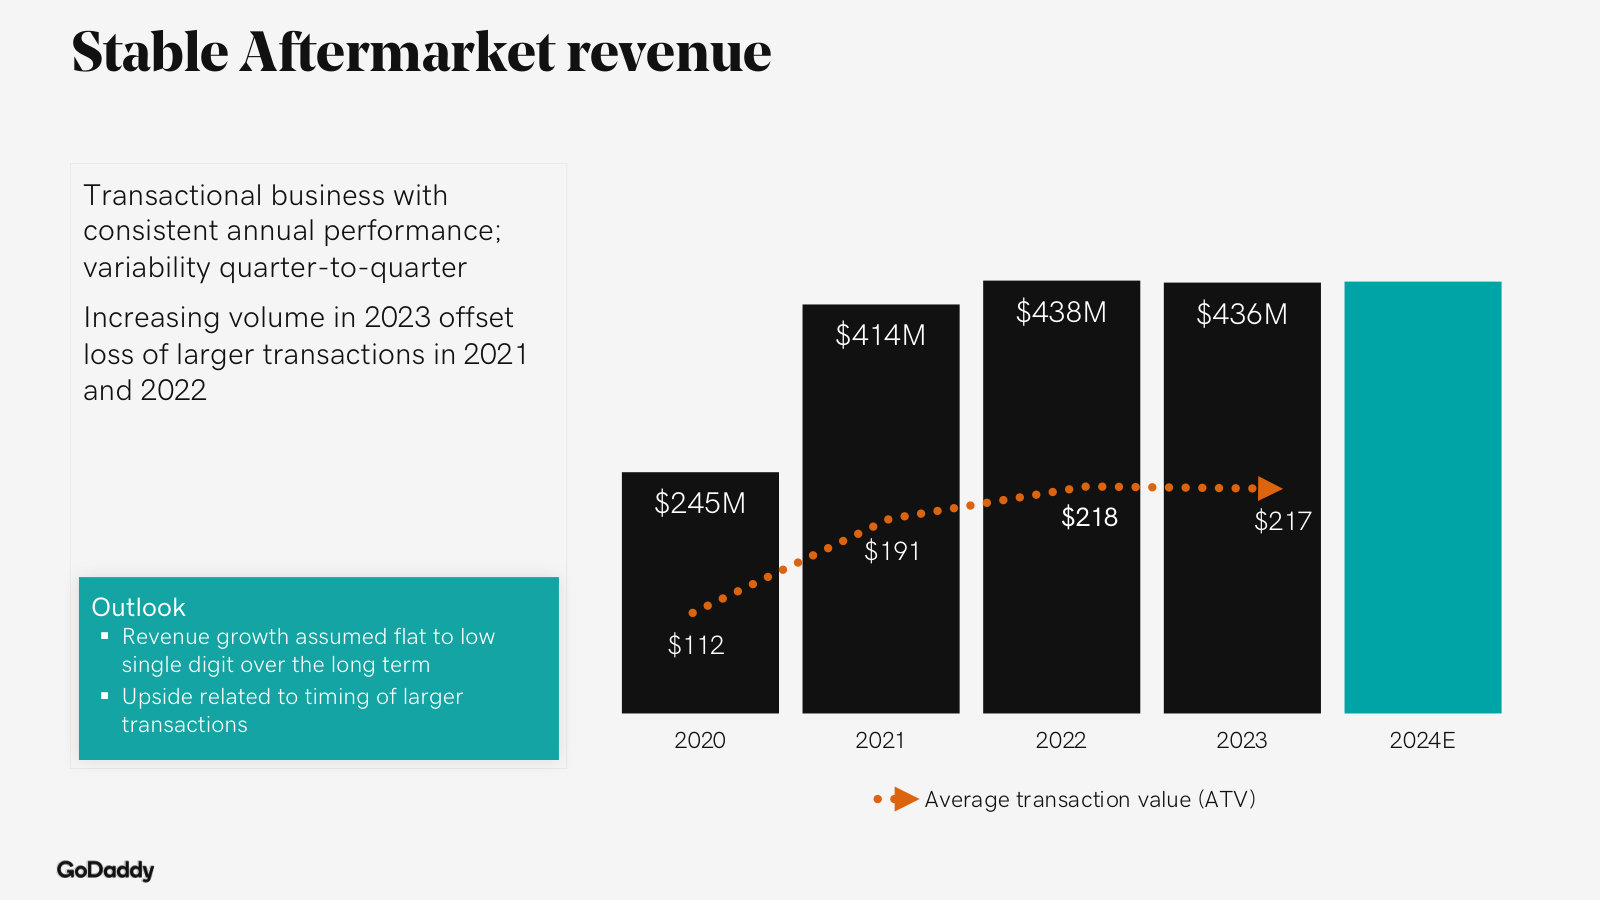
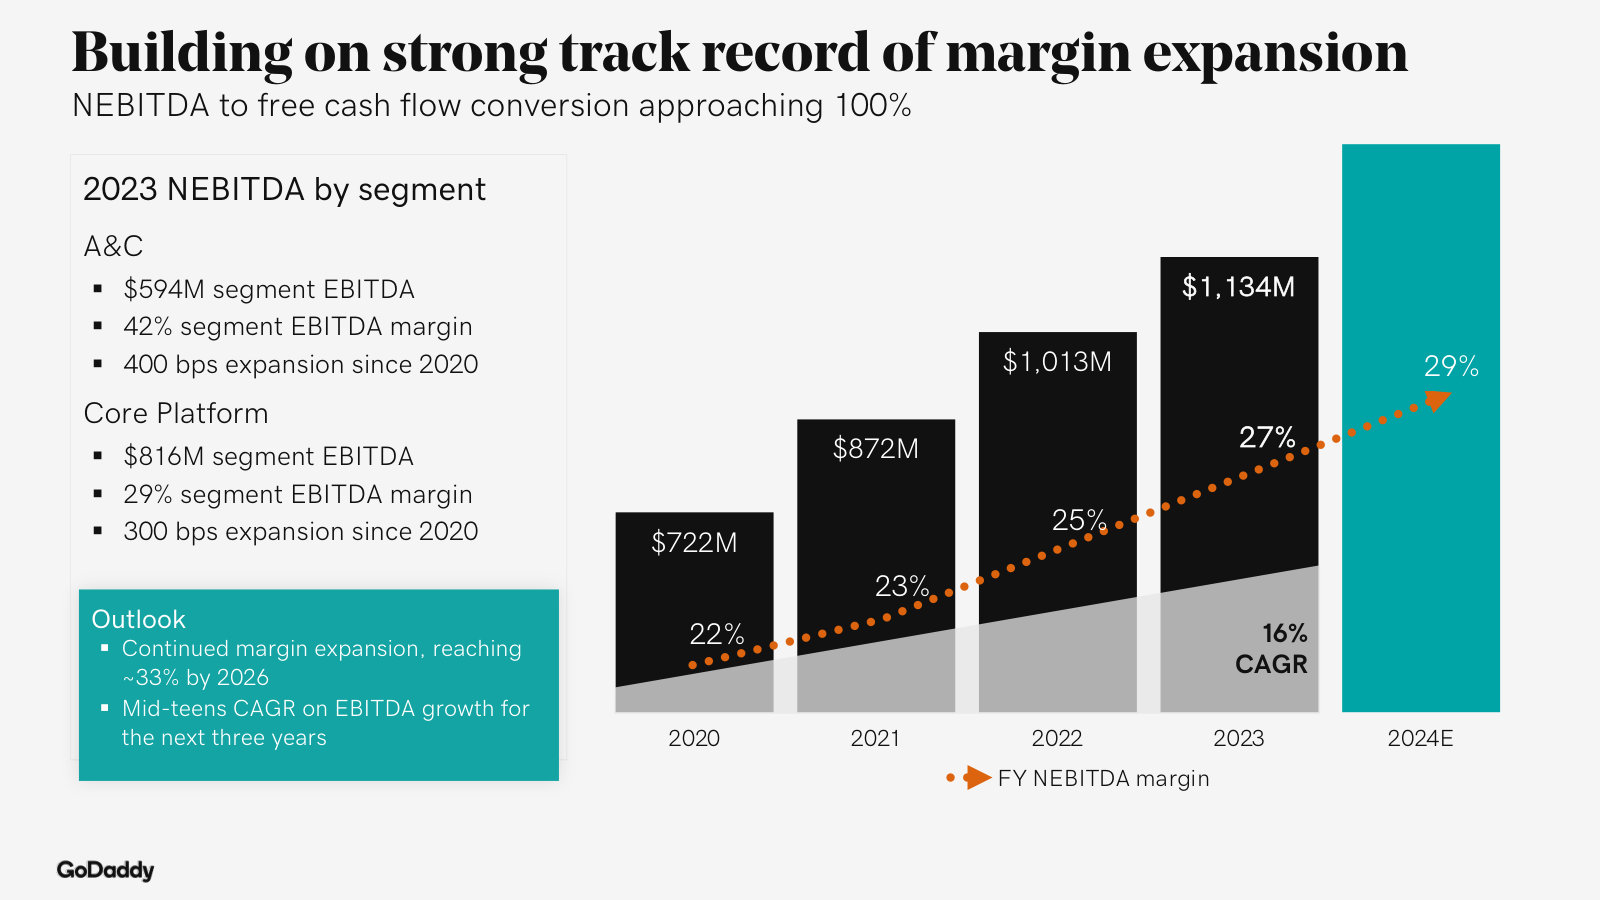
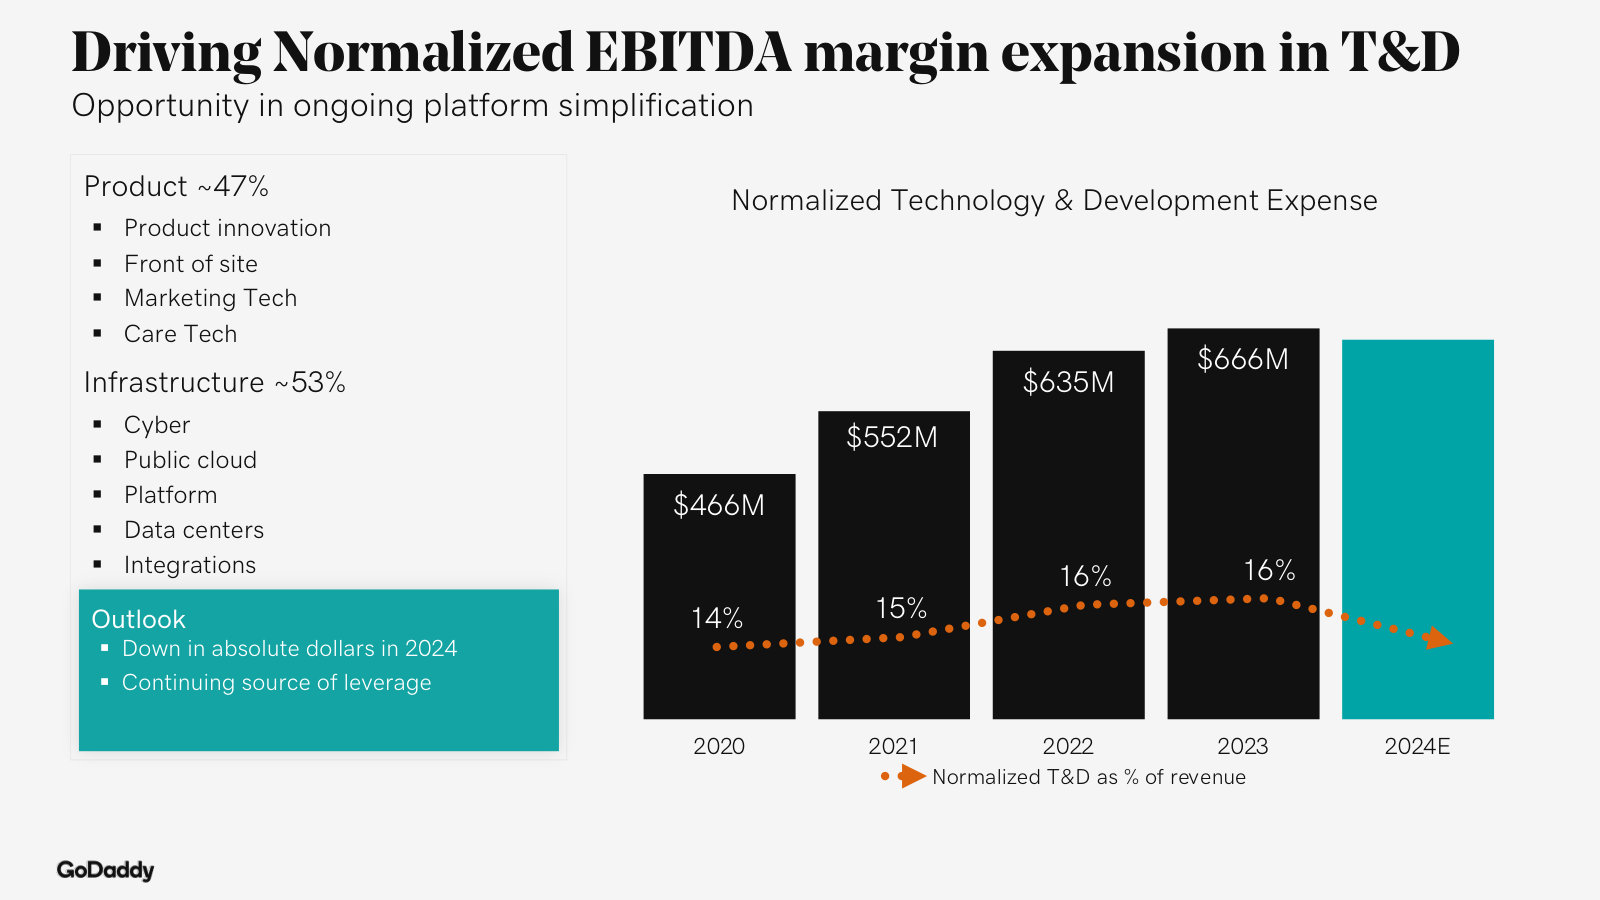
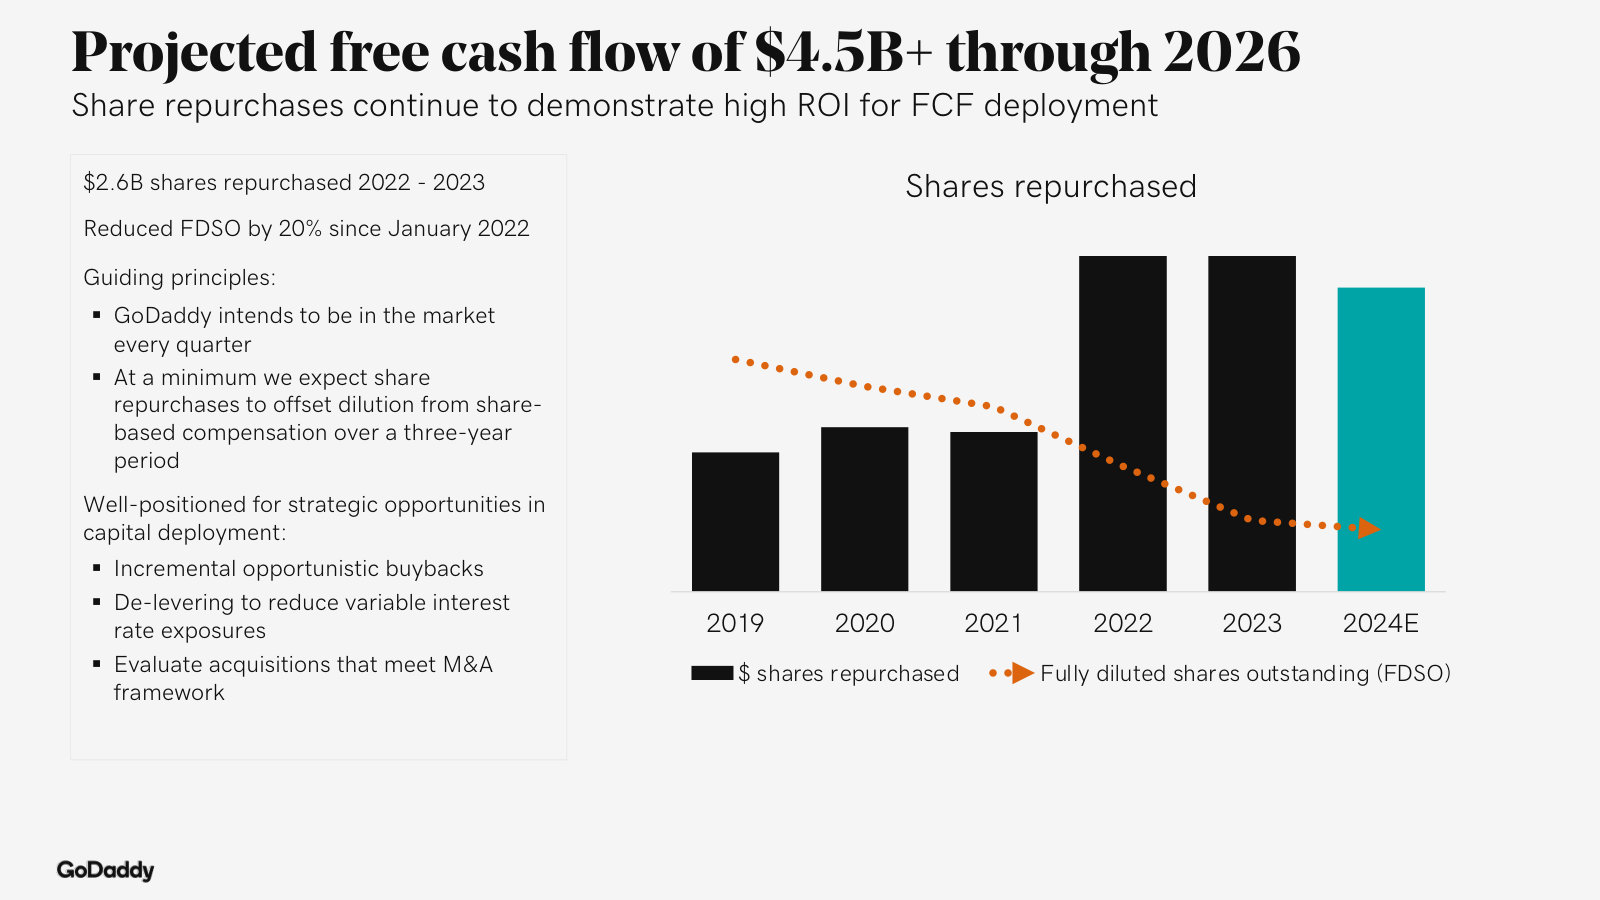
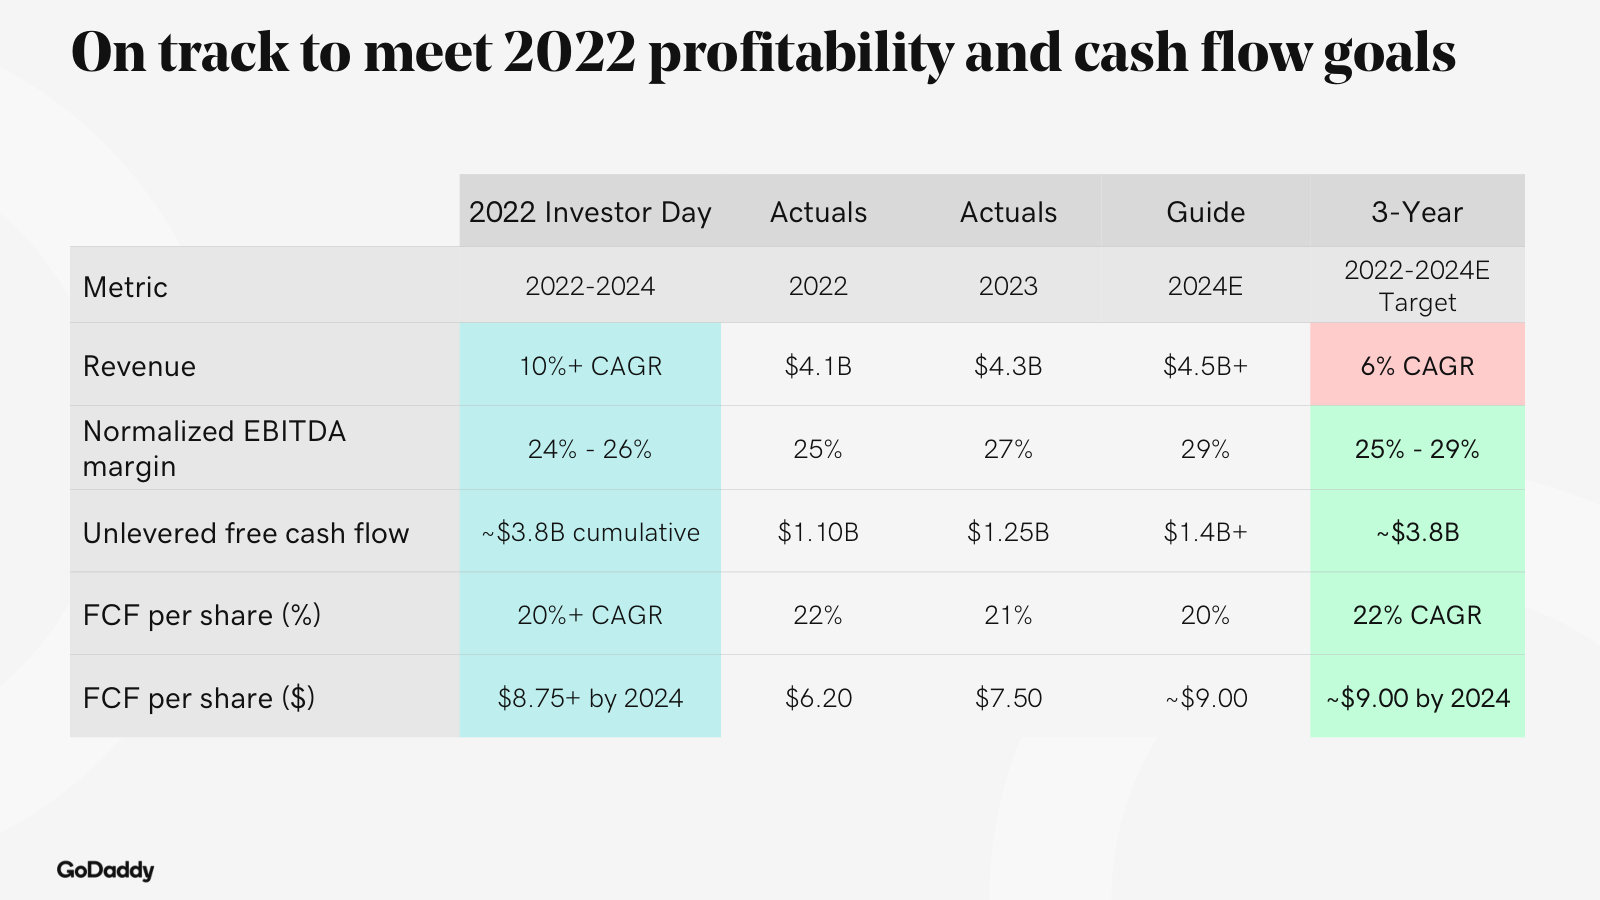
More from management
Q1 2026 Earnings Presentation — Q1 2026 · 36 pages · The latest quarterly results and guidance in management's own detail, beyond the summary carried in the overview deck. · Open →
Q4 & Full-Year 2025 Earnings Presentation — Q4 2025 · 41 pages · Full-year 2025 results and the initial 2026 outlook — the numbers the current targets are anchored to. · Open →
GoDaddy Inc.'s management answers for the business every quarter. These are the exchanges that explain it best — verbatim, from the call transcripts preserved in Sources. Each link opens the full transcript at that page in a new tab.
Q1 FY2026 Earnings Call — Q1 FY2026
The current state: AI products beginning to monetize, ANS as a new identity layer, and the thesis tested on Airo economics and buyback pace. · Open the full transcript →
How the two segments make money: high-margin A&C now ~40% of the business, Core Platform driven by primary domains.
Mark McCaffrey (CFO): For our high-margin A&C segment, we drove 12% growth in revenue to $0.5 billion on continued solid attach of our subscription-based solutions. A&C ARR grew 10%, and this segment now represents approximately 40% of our total business. Segment EBITDA margin improved 110 basis points to 45% on product mix. Our Core Platform segment delivered revenue growth of 3% to $769 million, on 5% growth in primary domains with a stronger mix towards higher-priced non-.com TLDs. This was partially offset by softness in non-core GoDaddy hosting, the .CO registry contract expiration and tougher compares in aftermarket. Segment EBITDA margin expanded 150 basis points to 33% on product mix.
p. 3 · Read in context →
How GoDaddy defines and measures a 'high-intent' customer — the core of the model.
Amanpal Bhutani (CEO); Vikram Kesavabhotla (Baird): On the cohorts that we're attracting, our strategy is to attract high-intent customers. The way we define high intent is by looking at the traffic coming in by channel and then looking at the activation and attach of other products. And what we know from years and years of data across our 20 million customers is that if we see that activation and attach of other products, we are going to see good renewal at the end of the one-year term.
p. 5 · Read in context →
Sizing the new AI product: the $10M Airo AI Builder run rate is early bookings from subscriptions and credits.
Amanpal Bhutani (CEO); Hoi-Fung Wong (Oppenheimer): When we talk about the $10 million run rate, we're really talking about annualized bookings. This is very early data. This includes both subscriptions and credits or tokens. […] In terms of what it could be, it's super early and we're excited about the early adoption. We just started selling it in Care. We're going to add paid marketing starting this month. We also have the large funnels with domains and website paths which we haven't fully leveraged yet.
p. 6 · Read in context →
The hardest exchange: with buybacks below free cash flow and cash building, management deflects to its track record.
Trevor Young (Barclays); Mark McCaffrey (CFO): And then second one on capital allocation: buybacks here in Q1 were well below free cash flow generation and the 95% payout stat that you've given. Meanwhile, cash at kind of the highest level since mid‑2021, if I'm not mistaken. Just any updated thoughts on capital allocation and buyback appetite with the stock at current levels? And in lieu of buybacks, any updated thoughts on M&A? […] On capital allocation, don't look at any particular quarter; look at our history — it's a good indicator of how we approach this. We look quarter by quarter, make determinations, and buybacks remain a strong lever to return value to shareholders. Our track record of returning capital shows how we approach this, and our philosophy hasn't changed.
p. 6 · Read in context →
Stated plainly: GoDaddy will let lower-LTV domain customers go rather than chase share.
Amanpal Bhutani (CEO); Eleanor Smith (JPMorgan): Is your intention to maintain or gain share? Or would you be willing to let some lower-LTV domain customers go at the expense of market share? […] We have said we will let lower-LTV customers go because our focus is on high-intent customers. Looking at the Domains business, we remain the world's largest domain registrar by far. Over the last 30 years we've faced many competitive pressures — low-priced registrars, loss-leader strategies, free domains and disruptive technologies — and we continue to compete. Our experience shows that value is in the high-intent customer: someone who buys a domain and then uses other products. That behavior drives LTV for GoDaddy and drives our business.
p. 9 · Read in context →
Q4 & Full Year 2025 Earnings Call — Q4 FY2025
The pivot call: full-year 2025 wrapped, the deliberate go-to-market change that dented bookings explained, and the moat vs AI entrants argued. · Open the full transcript →
The self-inflicted headwind, first admitted: a .com promo drew more demand than expected, cutting near-term bookings and revenue.
Amanpal Bhutani (CEO): Domains have been and will continue to be GoDaddy's strong, durable cash-generative engine serving as a long-term funnel to drive GoDaddy's growth. To further build on this resilient foundation and bring more quality customers onto the platform, this quarter, we expanded our go-to-market approach with a streamlined purchase experience for new domain customers. […] We activated our marketing channels on the streamlined experience and introduced a promotional price for .com domains with a one-year term. The approach successfully increased new customer volume that purchased domain units with one-year terms. But the demand for this offer was greater than we expected. And the shift in term mix, combined with the promotional price, reduced upfront bookings and nearterm revenue.
p. 2 · Read in context →
The compounding engine, quantified: the $500-plus cohort, rising ARPU and retention, five years of margin gains converting 1:1 to cash.
Mark McCaffrey (CFO): We see this most clearly in our highest value cohorts who spend more than $500 annually, which grew 11% and that represent approximately 10% of our total base. These customers have meaningfully higher second and third product attach rates and near-perfect retention. The result is compounding value creation with ARPU increasing 10% to $242 and overall retention rates rising above 85%. […] Full year normalized EBITDA grew 14% to $1.6 billion and a margin of 32%, representing 150 basis points of expansion over the prior year. Over the past five years, cumulative margin expansion of 1,000 basis points reflects our ability to scale efficiently while continuing to invest in the business. This margin expansion flows through directly to cash generation. Free cash flow grew a robust 19% to $1.6 billion with a normalized EBITDA to free cash flow conversion of greater than 1:1.
p. 4 · Read in context →
How much of the 2026 slowdown is self-inflicted: two-thirds is the .CO loss and aftermarket, one-third the go-to-market change.
Mark McCaffrey (CFO): With this, our full year revenue outlook incorporates just over 200 basis points of cumulative impact from the expiration of the .CO registry contract, the continued exclusion of high-value aftermarket transactions, and the go-to-market and product evolution we spoke about. The .CO and aftermarket impacts represent approximately two-thirds of this amount, while one-third is from the go-to-market and product evolution. For the full year, we expect total revenue to be within a range of $5.195 billion to $5.275 billion, representing growth of approximately 6% at the midpoint
p. 4 · Read in context →
Management's own framing of the go-to-market change — and its admission it worked better than planned.
Vikram Kesavabhotla (Baird); Amanpal Bhutani (CEO): My first one is on this promotional offer with .com. Can you talk more about why you decided to make that change in your go-to-market strategy? And you referenced seeing some improvements in February. Could you talk more about what you're observing there? And I guess from a higher level, do you think this was a one-time headwind to bookings in 2026? Or is there a potential for this change in the strategy to weigh on bookings as we move beyond this year? […] So the go-to-market evolution is really about opening up the top of the funnel and is attracting a lot more high-intent customers. And it's more than just an offer. It's a path, an optimized path that allows customers to come in and convert at a much, much higher rate. So there are three core components to it. There's the new path, the optimized path, the offer, and the marketing channels that we enabled to sort of drive traffic into it. Overall, we're very happy with the results. It attracted a lot of new customers. It was a bit more successful than we thought.
p. 5 · Read in context →
The competitive hedge: AI entrants aim at enterprise; GoDaddy serves the roofer and cleaner — but is 'not immune.'
Arjun Bhatia (William Blair); Amanpal Bhutani (CEO): So I'm curious, just as you looked at your old funnel, was there anything that sort of was indicating that the competitive intensity was increasing, especially from some of the Vibe coding players out there. And Aman, I think you touched on the moat there a little bit, but I'm curious how the new motion will maybe help you sort of defend against some of the competitors that are coming into the space? […] When I look at the competitors in the AI space, we still continue to see a lot of that focus being on enterprise employees, like product managers, people that work within enterprises or people that are a little bit sort of working for agencies or companies like that. We see less of that behavior with our direct customer, the person who is the roofer, the cleaner, some micro business owner. So we see less of that. Our expansion of go-to-market is really about being able to bring more high-intent customers into the domains funnel, which is our largest funnel and then attach to it very well. Like that is the primary motion at our company, and we want to continue to reinforce that more and more. I'm not suggesting that we are immune to what's happening in the world, we just have not seen a very large impact of that in our funnel yet or at this time.
p. 10 · Read in context →
Q3 FY2024 Earnings Call — Q3 FY2024
The clearest walk-through of the operating model — segment economics, the pricing method, capital allocation, and how Airo turns discovery into revenue. · Open the full transcript →
The strategy in two sentences: conversion, attach and retention feed a profitable-growth model aimed at free cash flow.
Aman Bhutani (CEO): Our strategy is relentlessly focused on creating customer value and transforming it to shareholder value through better conversion, attachment, and retention. This is the driving force behind our profitable growth model, propelling us towards our north star of maximizing free cash flow over the long-term.
p. 1 · Read in context →
The two-segment economics: high-margin A&C at a 46% segment margin, ~85% retention, over half of customers on two-plus products.
Mark McCaffrey (CFO): For our high-margin A&C segment, we drove 20% growth in bookings and 16% growth in revenue to $423 million, in line with our guided range on the strong performance of the growth initiatives Aman spoke about earlier. The segment EBITDA margin for A&C improved to 46% on the strength of our high gross margin proprietary solutions partially offset by the strong performance and lower gross margin profiles of our commerce offerings and third-party solutions. […] ARPU grew 8% to $215 on a trailing 12-month basis, while our customer count declined slightly to $20.7 million. With the previously mentioned divestiture and migration efforts behind us, we expect to return to customer growth in 2025. Currently, our consolidated customer retention rate remains at 85%, and over 50% of our customers have two or more paid products with us.
p. 2 · Read in context →
Capital allocation, quantified: buybacks running ahead of the 20% share-reduction target, toward $4.5B+ cumulative free cash flow.
Mark McCaffrey (CFO): We drove a 23% reduction in gross shares outstanding since January 2022, 3 points ahead of our three-year targeted reduction of 20%. […] We are pleased with our progress towards our Investor Day target of $4.5 billion plus in cumulative free cash flow generation supported by 6% to 8% annual revenue growth and expansion of our normalized EBITDA margin to 33% by 2026.
p. 2 · Read in context →
How GoDaddy actually prices: experiment along a price-elasticity curve to balance retention against the pricing opportunity.
Aman Bhutani (CEO); Trevor Young (Barclays): pricing and bundling is about finding the right cohorts of customers, where we can provide the right value to customers and then price along with that value. The way we do this is by experimenting at different price points to find the price elasticity curve. What that curve helps us do is find the right cohorts where we can balance attrition for customers, right, or let's say, retention of customers with the pricing opportunity in front of us.
p. 5 · Read in context →
How Airo monetizes: discovery, then engagement, then paywalls that convert engaged users into paid subscriptions.
Aman Bhutani (CEO); Ygal Arounian (Citi): The progress with Airo goes on a timeline of discovery, engagement, and monetization. Discovery is about getting Airo in front of as many customers as possible and getting them to discover that GoDaddy has a breadth of products available to them. The engagement piece is about getting them to engage in some of those products, and you’ll remember that we call those Airo cards, getting customers to click on them, engage with them, and set something up. We're seeing really good traction on discovery and engagement. Over the last quarter or two, we started to put up paywalls where, along with that engagement, if, for example, a customer got a coming soon page and wanted to customize it a little bit, if they wanted to do more, a paywall would appear and say you need to buy a subscription or websites plus marketing. It's possible that a customer would have bought it anyway, two months or three months down the line, and we would have gotten that attachment. But what Airo offers is the ability for us to paywall right there, getting the customer to make that decision. That paywall is connected to the 40% that I talked about today.
p. 7 · Read in context →
Q1 FY2024 Earnings Call — Q1 FY2024
The cleanest primer on how GoDaddy is built: the North Star, the two segments and their margins, and the bookings-versus-revenue mechanic. · Open the full transcript →
The North Star and its two pillars, set against the Investor Day framework — the base a reader needs.
Amanpal Bhutani (CEO): At our Investor Day, we shared our updated 3-year strategic framework and financial targets. As our Q1 results showcase, we are off to a strong start in 2024. In service of ou North Star, we continue to expand our free cash flow meaningfully, delivering 26% free cash flow growth year-over-year. The pillars behind our North Star are accelerating growth in our applications and commerce segment and disciplined margin expansion.
p. 1 · Read in context →
The two segments defined, with GoDaddy Payments passing $2B in annualized volume for the first time.
Mark McCaffrey (CFO): The key pillars underlying our North Star are the double-digit growth in our application and commerce segment revenue of 13%, coupled with disciplined normalized EBITDA margin expansion to 28%, which converts to free cash flow at an impressive 1:1 ratio. […] our higher-margin Applications & Commerce segment delivered $383 million in revenue, growing 13%, in line with our guided range. The drivers of this performance included strength in our bundling and pricing initiatives across all major product offerings, including productivity solutions, website building products, and commerce. Additionally, annualized GPV for GoDaddy payments grew to $2 billion for the first time. Segment EBITDA margin was 42%, up over 300 basis points. Lastly, ARR for Applications & Commerce grew 13% to $1.5 billion. Core platform revenue totaled $725 million, growing 4% which exceeded our guidance on strength in domains, up 7% and aftermarket, up 12%. Our growth was driven by strong demand for domains in the primary and secondary market, increased pricing in the primary market, and a higher average transaction value in the secondary market. This was partially offset by a decrease in hosting due to our divestitures. Segment EBITDA margin for the core platform grew to 30%, up nearly 300 basis points.
p. 2 · Read in context →
How to read bookings versus revenue — the cash-collected leading indicator that drives the whole 2026 debate.
Mark McCaffrey (CFO): Moving on to bookings, in Q1, we achieved 9% growth on our reported and constant currency basis, reaching $1.3 billion. As a reminder, bookings primarily represent the cash collected during the period. Applications in commerce bookings grew 22% from improvements in pricing and bundling for productivity solutions, website building products, and commerce. Core platform bookings increased 3% on the performance of domains in the aftermarket due to strong demand for domains in the primary and secondary market, offset by headwinds in hosting. Subscription bookings grew 2 points ahead of subscription revenue.
p. 3 · Read in context →
More calls
Q3 FY2025 Earnings Call — Q3 FY2025 · 13 pages · Where Agent Name Service was first introduced and the 2025 revenue guide was raised toward ~$4.94 billion. · Open →
Q2 FY2025 Earnings Call — Q2 FY2025 · 11 pages · The mid-2025 raise of the full-year free-cash-flow target to ~$1.6 billion, with the agentic-Airo narrative building. · Open →
Q1 FY2025 Earnings Call — Q1 FY2025 · 10 pages · The AI narrative's early-2025 shift toward an agentic Airo, before the go-to-market change reshaped the story. · Open →
Q4 & Full Year 2024 Earnings Call — Q4 FY2024 · 16 pages · The FY2024 results and the original 2025 guidance framework — free cash flow of at least $1.5 billion and ~100 bps of margin expansion toward the 33% target. · Open →
Q2 FY2024 Earnings Call — Q2 FY2024 · 13 pages · Mid-2024 pricing-and-bundling momentum and Airo scaling, the quarter before the featured Q3 operating-model call. · Open →
Q4 & Full Year 2023 Earnings Call — Q4 FY2023 · 31 pages · Full-year 2023 results and the three-year Investor Day framework as first laid out (note: transcript is a third-party web capture with formatting noise). · Open →
Q4 & Full Year 2021 Earnings Call — Q4 FY2021 · 36 pages · Bhutani's early full-year strategy and the pre-Airo domains-plus-presence-plus-commerce model (note: third-party web capture with formatting noise). · Open →
GoDaddy Inc.'s annual reports contain management's most considered account of the business. These are the sections, passages and visual pages worth opening in the originals preserved in Sources.
GoDaddy Inc. — FY2025 Annual Report (Form 10-K) — FY2025 (year ended Dec 31, 2025)
Management's fullest account of the AI-first "Entrepreneur's Wheel" pivot, the domains franchise, and the two-segment economics behind $4.95B of revenue. · Open the full document →
Item 1. Business — Overview — p. 7 · Read the full section →
The one-paragraph self-definition: a 20.4M-customer one-stop shop for entrepreneurs, now organized around the Identity/Presence/Commerce "Entrepreneur's Wheel."
How GoDaddy defines itself and its 20.4M-customer base.
GoDaddy is a global leader serving a large market of entrepreneurs, developing and delivering easy-to-use solutions as a onestop shop provider, backed by proactive, informed and personalized guidance. […] Our 20.4 million customers are passionate and determined to transform their ideas into something meaningful.
p. 7 · Read in context →
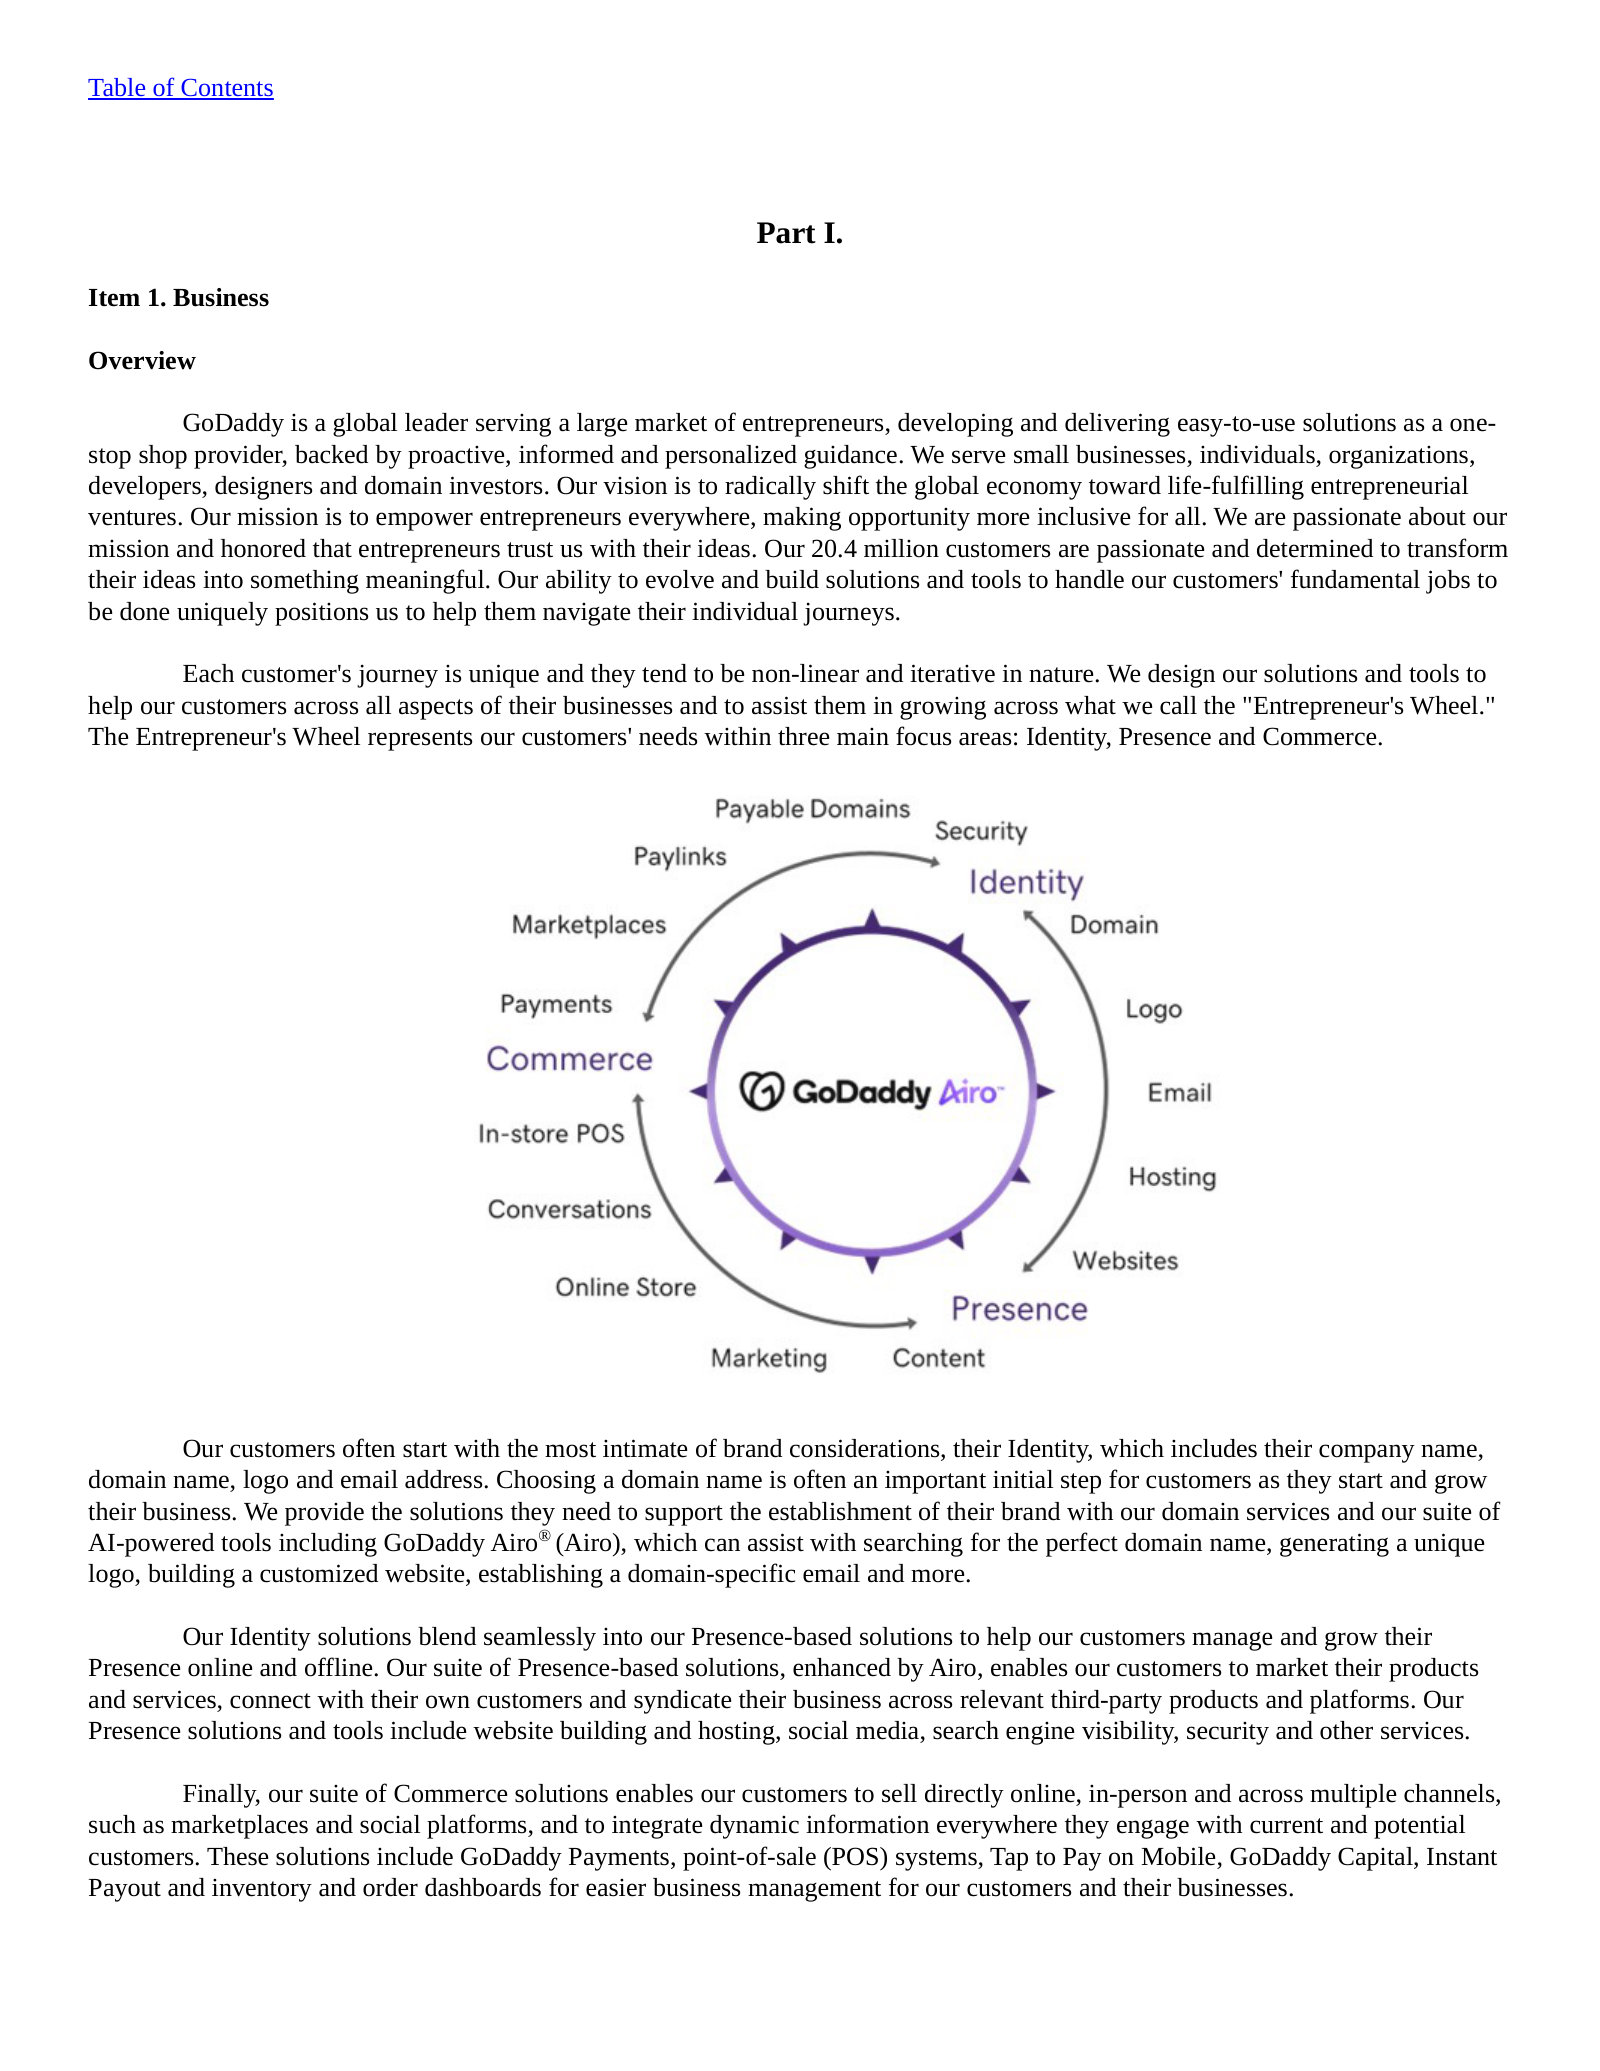
Our Solutions and Experiences — Domains — p. 15 · Read the full section →
Domains are the front door and the scale moat: global #1 with ~21% of all registered domains and a 94% attach across the customer base.
Global leader in domain registration: ~81M domains, ~21% share, ~94% of customers attach.
We are the global leader in domain name registration, with approximately 81 million domains under management as of December 31, 2025. Based on information reported in VeriSign's most recent Domain Name Industry Brief, this represented approximately 21% of the approximately 387 million domain names registered worldwide as of December 31, 2025. As of December 31, 2025, approximately 94% of our customers purchased a domain from us.
p. 17 · Read in context →
Our Opportunity and Advantages — p. 21 · Read the full section →
The economic engine in management's words — ~85% retention, bookings ahead of revenue, and 2M+ customers spending over $500/year.
The recurring-revenue model: $4.95B revenue, $5.40B bookings, ~85% retention, 2M+ high-spend customers.
In 2025, we generated $4,951.1 million of revenue, up 8.3% from $4,573.2 million in 2024, and we generated $5,400.0 million in total bookings, up 7.2% from $5,038.8 million in 2024. […] In each of the five years ended December 31, 2025, our customer retention rate was approximately 85%, with the exception of the year ended December 31, 2024 when the retention rate was approximately 84% due to divestitures, migrations and end of life of certain products as part of our efforts to streamline brands outside of the GoDaddy platform. […] in 2025, we had over 2.0 million customers who each spent more than $500 a year on our product offerings.
p. 23 · Read in context →
Item 1A. Risk Factors — Evolving technologies, including AI, may reduce demand — p. 48 · Read the full section →
The existential question for the franchise: whether AI agents and shifting internet habits erode demand for domains and websites.
Item 1A. Risk Factors — Substantial reliance on AWS — p. 60 · Read the full section →
A concrete single-vendor dependency: the integrated platform runs largely on AWS, so an AWS outage is a GoDaddy outage.
Much of the cloud platform is provisioned through AWS, exposing GoDaddy to AWS service interruptions.
A substantial portion of our cloud infrastructure is provisioned through AWS, which hosts several of our products and our integrated platform. Our customers need to be able to access our platform at any time, without interruption or degradation of performance. AWS runs its own platform that we access, and we are, therefore, vulnerable to service interruptions at AWS.
p. 60 · Read in context →
Item 1A. Risk Factors — Registry and ICANN fees — p. 81 · Read the full section →
The domains economics sit atop fees set by VeriSign and ICANN — a cost base GoDaddy does not control.
Per-registration fees charged by registries (VeriSign) and ICANN feed directly into operating results.
Each registry typically imposes a fee in association with the registration of a domain name. For example, VeriSign, the registry for .com and .net, has a current annual list prices of $10.26 and $11.66 for .com and .net registrations, respectively, and ICANN charges $0.20 for most domain names registered in the gTLDs within its purview.
p. 81 · Read in context →
Item 7. MD&A — Results of Operations — p. 117 · Read the full section →
The consolidated P&L and where 2025's 8.3% growth came from — A&C subscriptions plus domain and aftermarket gains in Core.
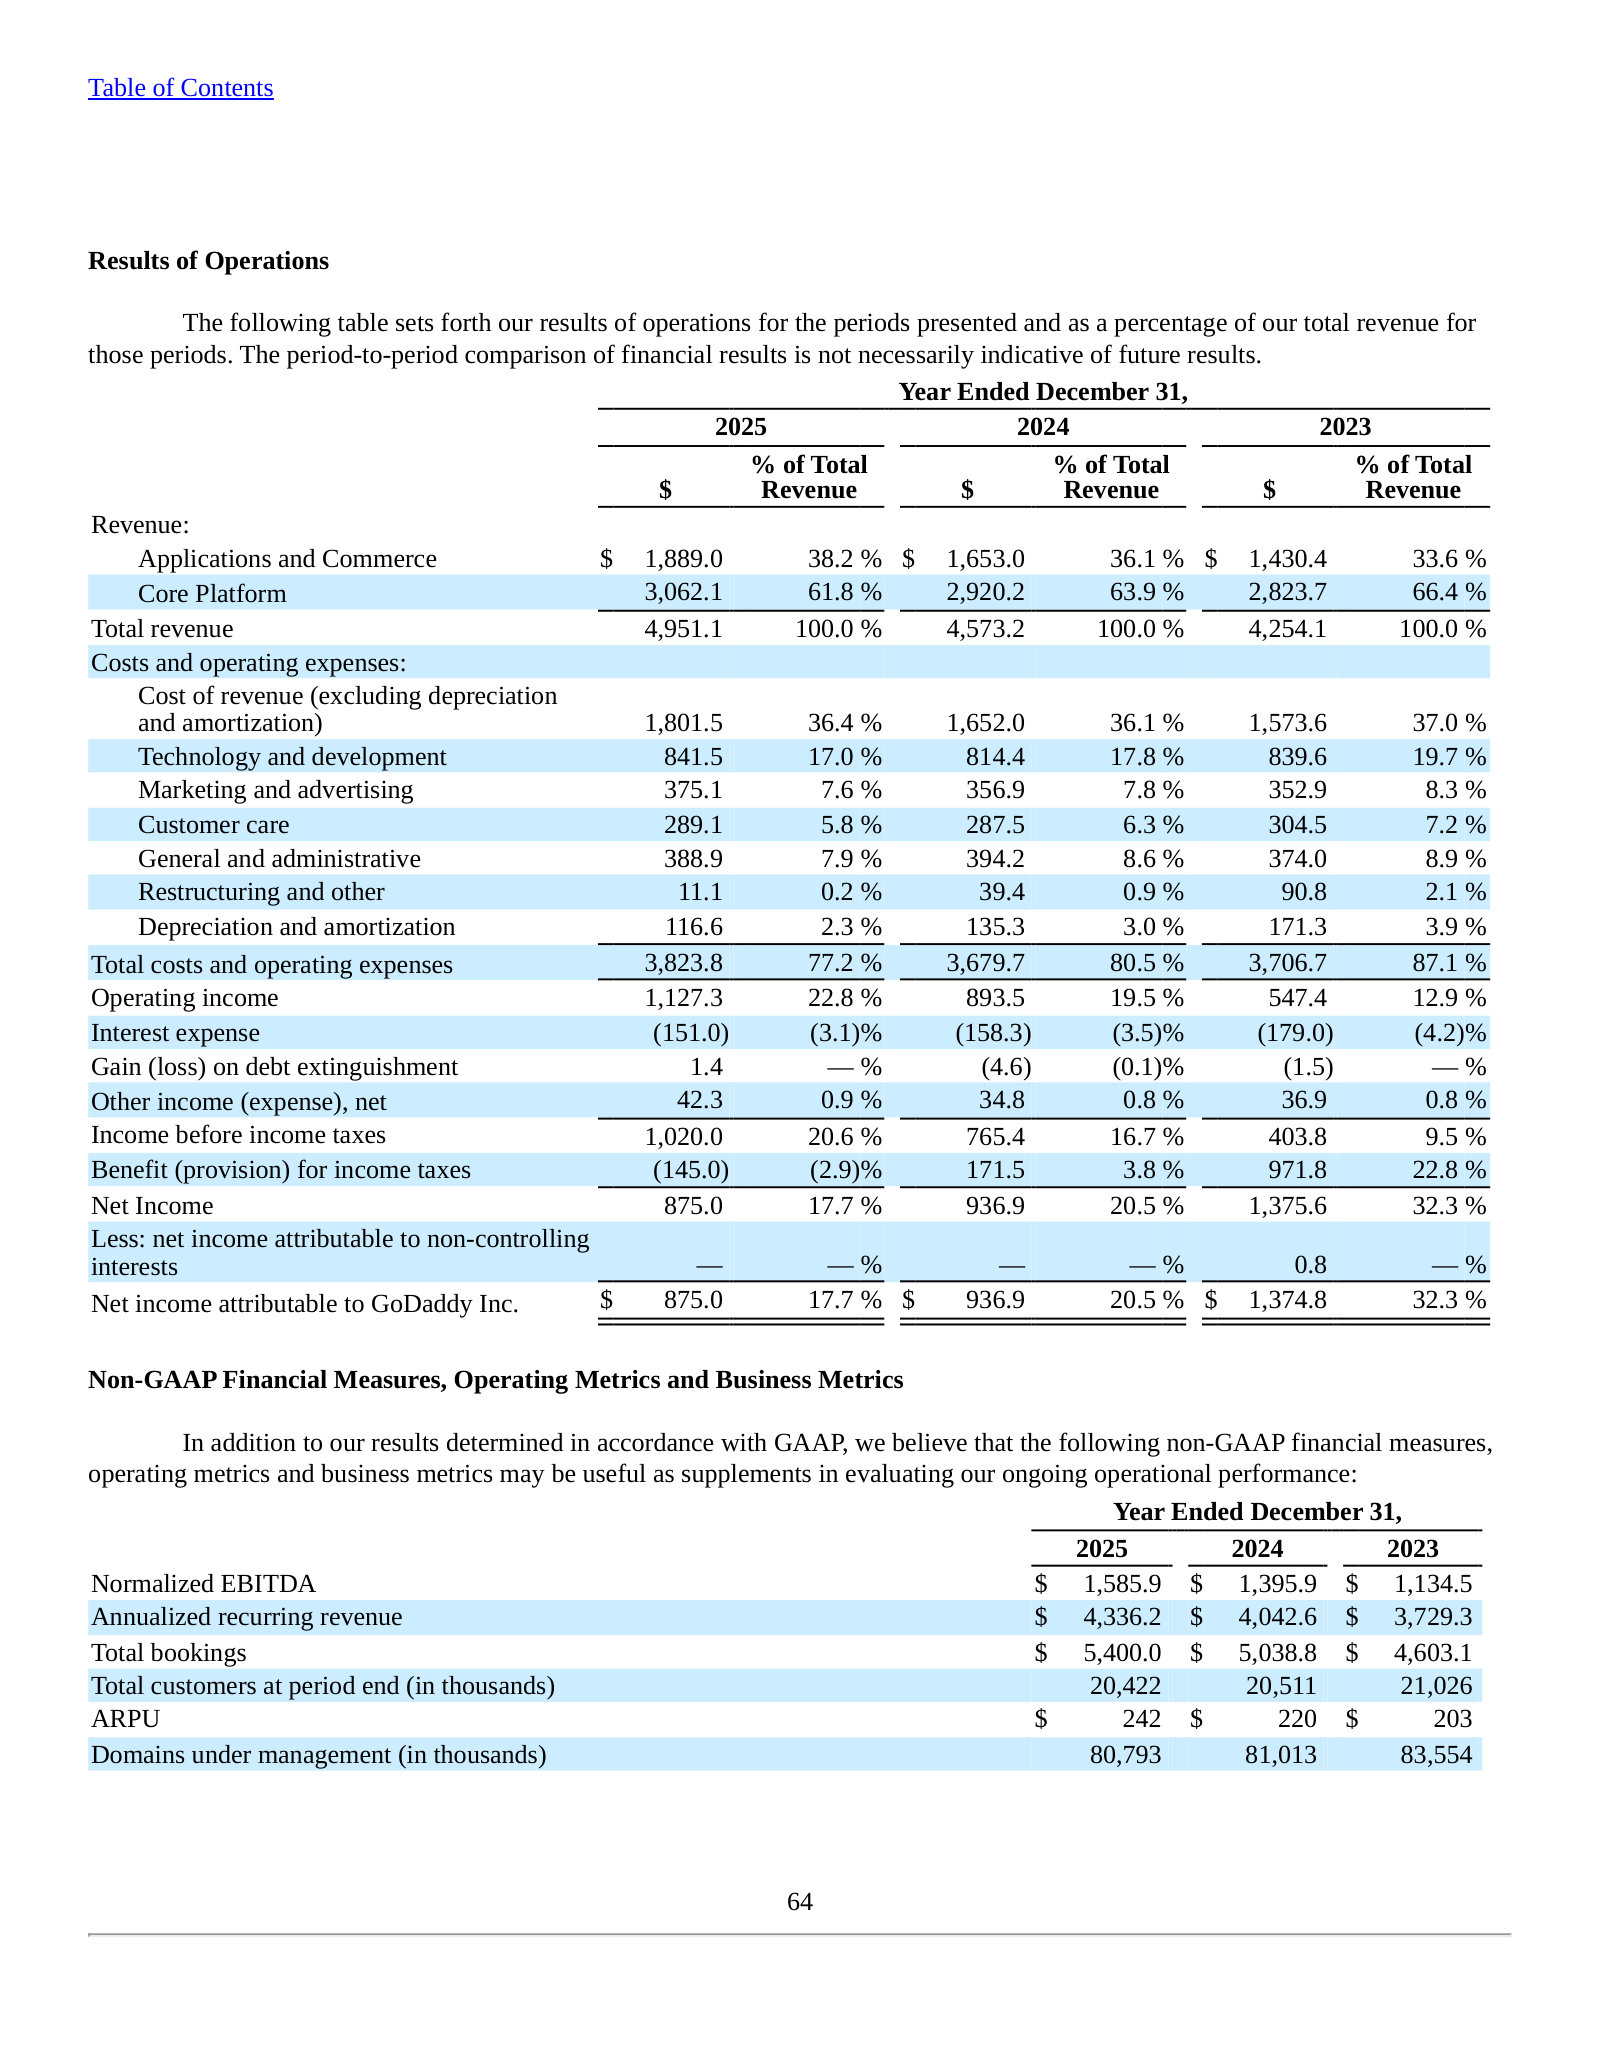
Revenue drivers: A&C +14.3% on subscription adoption; Core +4.9% on domains and aftermarket.
Total revenue increased 8.3%, due to the increases in our A&C and Core revenues, as described below:
A&C. The $236.0 million, or 14.3%, increase in A&C revenue for the year ended December 31, 2025 was due to continued customer adoption of our subscription-based products.
Core. The $141.9 million, or 4.9%, increase in Core revenue for the year ended December 31, 2025 was driven by $104.6 million growth in domain registration and add-on revenues and $53.2 million growth in aftermarket revenue.
p. 119 · Read in context →
Item 7. MD&A — Segment Results of Operations — p. 125 · Read the full section →
The margin story the segments tell: high-margin A&C (~45%) is the growth engine while larger Core (~33%) is the cash base.
A&C segment EBITDA +15.9% (45.4% margin) — the higher-margin growth engine.
The $117.6 million, or 15.9%, increase in A&C Segment EBITDA for the year ended December 31, 2025 was attributed to a $236.0 million increase in revenue as described above.
p. 125 · Read in context →
Core segment EBITDA +8.4% (33.0% margin) — the larger, steadier cash base.
The $78.6 million, or 8.4%, increase in Core Segment EBITDA for the year ended December 31, 2025 was attributed to a $141.9 million increase in revenue as described above.
p. 126 · Read in context →
Item 7. MD&A — Critical Accounting Policies: Revenue Recognition — p. 130 · Read the full section →
The policy that defines the model: cash is collected upfront but domain revenue is recognized ratably, creating the bookings-vs-revenue and deferred-revenue dynamics.
Domain revenue is recognized ratably over the registration term — the source of GoDaddy's deferred-revenue balance.
Revenue is recognized when control of a promised good or service (product) is transferred to the customer, in an amount reflecting the consideration we expect to be entitled to in exchange for such product. […] Domain registration and renewal revenue is recognized ratably over the registration period as the customer simultaneously receives and consumes the benefits over the contract term.
p. 130 · Read in context →
GoDaddy Inc. — FY2021 Annual Report (Form 10-K) — FY2021 (year ended Dec 31, 2021)
A pre-AI baseline: before Airo and the A&C/Core segments, the business was framed around product lines (Domains, Hosting & Presence, Business Applications, Connected Commerce). · Open the full document →
Item 1. Business — Overview — p. 7 · Read the full section →
Shows the strategy reset — 2021's "everyday entrepreneurs" and connected-commerce framing predates the 2025 Entrepreneur's-Wheel and AI-agent language.
The 2021 self-description: 21.2M "everyday entrepreneurs," identity/presence/connected commerce — no AI or Airo yet.
GoDaddy is a global leader in serving a large market of everyday entrepreneurs, delivering simple, easy-to-use products, and outcome-driven, personalized guidance to small businesses, individuals, organizations, developers, designers and domain investors. […] We champion everyday entrepreneurs by empowering them with sage guidance set in seamlessly intuitive experiences to create and protect their digital identity, establish and maintain a ubiquitous presence online and participate in the world of connected commerce. […] Our 21.2 million customers are passionate, everyday entrepreneurs with vibrant ideas, who are determined to make their way in the world and to transform their ideas into something meaningful.
p. 7 · Read in context →
More annual reports
GoDaddy Inc. — FY2024 Annual Report (Form 10-K) — FY2024 · 197 pages · The immediate prior year: A&C/Core segments established, revenue $4.57B, retention dipped to ~84% on divestitures. · Open →
GoDaddy Inc. — FY2023 Annual Report (Form 10-K) — FY2023 · 224 pages · First full year under the redefined Applications & Commerce / Core Platform segment structure. · Open →
GoDaddy Inc. — FY2022 Annual Report (Form 10-K) — FY2022 · 211 pages · The transition year toward the current segment reporting and the profitable-growth restructuring. · Open →
Competitors describe GoDaddy Inc.'s market in their own filings and calls. These verified passages and visual pages show where their strategies meet, using source documents preserved in Sources.
Wix.com Ltd. (WIX)
The closest pure competitor to GoDaddy's website-building franchise. Wix runs a freemium, AI-driven platform that lets small businesses, entrepreneurs and creators build and host a professional website, register a domain and sell online — the same jobs GoDaddy's Websites + Commerce and Airo products do. Wix is one of the very few peers that names GoDaddy directly in its filings, and its FY2025 20-F treats large domain-and-hosting companies and generative-AI website builders as the competitive threats it must answer.
Wix names GoDaddy directly in the Competition section of its FY2025 20-F, placing it among the "large service companies that primarily offer domain registration and hosting services" that also let owners build a website — and flags generative-AI website builders as the emerging overlap. This is a competitor's own framing of where it collides with GoDaddy.
We enable our registered users to create a customizable, fully integrated and professional digital presence through an attractive web-based software platform with various marketing and workflow management capabilities. […] The market for providing web-based website design and management software is evolving and highly fragmented today. We believe no provider currently offers a comprehensive, customizable, fully integrated workflow solution to create and manage a professional digital presence comparable to ours. […] Additionally, several large service companies that primarily offer domain registration and hosting services, such as GoDaddy, provide the ability for a business owner to build a website using their tools or have one built by their workforce. Moreover, newly emerging technologies that utilize AI may also offer services that overlap with certain solutions we offer, including the emergence of generative AI website builders.
p. 141 · Read in context →
Wix sizes its user base and describes a product bundle — AI website builder, web design, domains, hosting, business and commerce solutions — that maps almost one-for-one onto GoDaddy's offering. It reports roughly 304.2 million registered users and 6.1 million paying subscriptions on a freemium model comparable to GoDaddy's funnel from free tools to paid plans.
We are a leading global cloud-based web development platform for millions of registered users and creators worldwide. Wix was founded on the belief that the Internet should be accessible to everyone and with the mission to enable anyone to express themselves online and for businesses and organizations to take their businesses, brands and workflows online to create and manage a fully integrated and dynamic digital presence. As of December 31, 2025, we empower approximately 304.2 million registered users worldwide who began the website building process with us. The Wix platform combines advanced AI, flexible web design, domains, hosting, templates and robust business and commerce solutions to help users build stronger brands, connect with their audiences, and scale their businesses online. […] We offer our solutions through a freemium SaaS business model (free and premium services), and as of December 31, 2025, we had approximately 6.1 million premium subscriptions.
p. 109 · Read in context →
Wix confirms it is itself an ICANN-accredited domain name registrar and sells domains as a stand-alone product — a direct overlap with GoDaddy's core domains business, and a reminder that the website builders are also fighting GoDaddy on the registrar leg.
We offer our users the ability to choose and connect their own domain name to their website to better enhance their brand, through third parties that offer domain names, or through our offering as an ICANN accredited domain name registrar. Domain names are offered as a stand-alone product, and also are included, on a limited basis, as part of our premium subscription offerings. Registered users without a premium subscription are assigned a free URL which includes the Wix site address.
p. 121 · Read in context →
IONOS Group SE (IOS)
The European mirror image of GoDaddy: a mass-market provider of domains, web hosting, AI website builders, e-commerce, email and security aimed squarely at small and medium-sized enterprises. IONOS competes with GoDaddy head-on in the United States and across Europe, and its product taxonomy ("Web Presence & Productivity" plus "Cloud Solutions") is the closest structural analogue to GoDaddy's own segment mix among the listed peers.
IONOS's self-description reads like GoDaddy's: an SME-focused provider whose Web Presence & Productivity division bundles domain registration, web hosting, AI-powered website builders, e-commerce, email, marketing, SEO and security — nearly the exact product list GoDaddy sells to the same customer.
IONOS is an internationally active digital transformation partner and reliable cloud enabler for small and medium-sized enterprises (SMEs), as well as for individual users (e.g., freelancers) and larger corporate clients. […] In the Web Presence & Productivity division, IONOS offers professional solutions for online presence, such as domain registration, web hosting, website builders powered by artificial intelligence, and dedicated servers. This is complemented by additional productivity tools (e.g., e-commerce, email, and marketing applications) as well as supplementary services such as search engine optimization, business applications, and storage and security solutions.
p. 5 · Read in context →
IONOS's stated scale and positioning: over six million customers and a self-styled role as a leading SME digital-transformation partner in the web-hosting and cloud markets across Europe and North America — the geographies where it overlaps most with GoDaddy.
A central pillar and a decisive competitive advantage is its loyal customer base of over six million customers worldwide. […] As one of Europe’s leading digital transformation partners for small and medium-sized businesses, IONOS has established a strong market position in the web hosting and cloud sectors in Europe and North America.
p. 53 · Read in context →
IONOS's read on the market's structure and stickiness: an SME web-presence market that is highly fragmented from the customer's side, with businesses reluctant to drop or re-price their website — the same low-churn, price-inelastic dynamic that underpins GoDaddy's recurring revenue.
By focusing on small and medium-sized enterprises in the areas of web presence and productivity, IONOS operates in a market that is highly fragmented from the customer’s perspective. […] For example, it is rather unlikely that a small or medium-sized enterprise would discontinue its website for cost reasons or regularly compare prices with lesser-known but comparable providers in order to switch providers. Instead, such companies often prioritize the reliability and stability of their existing website over potential cost savings.
p. 6 · Read in context →
Tucows Inc. (TCX)
A direct competitor on GoDaddy's domains leg. Tucows is one of the world's largest wholesale domain registrars (OpenSRS, Enom, Ascio) and also sells retail domains and email to individuals and small businesses through Hover — the same registrar market where GoDaddy is the scale leader. Its filings describe the shared domain economics, pricing pressure and the industry's competitive structure from the wholesale side.
Tucows describes its domains business — wholesale plus retail registration and email to individuals and small businesses, roughly 32,000 resellers across ~200 countries, and 21.5 million domains under management — the registrar market GoDaddy leads at retail.
Tucows Domains includes wholesale and retail domain name registration services, as well as value-added services derived through our OpenSRS, Enom, Ascio, EPAG and Hover brands. […] In addition, we earn revenues from the sale of retail domain name registration and email services to individuals and small businesses. […] Our primary distribution channel is a global network of more than 32,000 resellers that operate in approximately 200 countries and who typically provide their customers, the end-users of Internet-based services, with solutions for establishing and maintaining an online presence. […] Together the OpenSRS, Enom, EPAG and Ascio Domain Services manage 21.5 million domain names under the Tucows, Enom, EPAG and Ascio ICANN registrar accreditations and for other registrars under their own accreditations.
p. 30 · Read in context →
Tucows on domain-market competition: intensifying price pressure as new registrars enter and rivals discount, and a wholesale market that is "price sensitive and competitive" — including large web-hosting companies as high-volume buyers, a category that includes GoDaddy.
The increased competition in the market for Internet services in recent years, which we expect will continue to intensify in the short and long term, poses a material risk for us. As new registrars are introduced, existing competitors expand service offerings and competitors offer price discounts to gain market share, we face pricing pressure, which can adversely impact our revenues and profitability. […] The market for wholesale registrar services is both price sensitive and competitive and is evolving with the introduction of new gTLDs, particularly for large volume customers, such as large web hosting companies and owners of large portfolios of domain names.
p. 32 · Read in context →
Shopify Inc. (SHOP)
The scale leader in the commerce platform market where GoDaddy competes with its Commerce and Websites + Commerce products. Shopify targets the same spectrum — from aspiring entrepreneurs starting online to larger merchants — and its filings size the merchant base and GMV that frame the commerce opportunity GoDaddy is chasing on the higher-value end of its customer base.
Shopify sizes the commerce flow it intermediates: $378.4 billion of gross merchandise volume in 2025, up 29%. It sets the scale of the commerce market GoDaddy addresses far more modestly through its own commerce and payments products.
In the year ended December 31, 2025, our platform facilitated gross merchandise volume ("GMV") of $378.4 billion, representing an increase of 29% from the year ended December 31, 2024.
p. 46 · Read in context →
BigCommerce Holdings, Inc. (BIGC)
An e-commerce platform competitor that, unlike enterprise-only rivals, explicitly runs a Small Business offering and owns a site builder (Makeswift), overlapping GoDaddy's SMB commerce and website ambitions. Its earnings calls give management's own view of the competitive landscape — including how it positions against Shopify and where it sees small-business opportunity.
BigCommerce's CEO lays out a portfolio — a commerce platform, a product-feed tool, and a "brand and commerce site builder and visual editor" (Makeswift) — organized around B2C, B2B and Small Business, the last of which puts it in GoDaddy's SMB commerce lane. (Q4 FY2024 earnings call.)
We have three owned products in our portfolio today: our flagship commerce platform, BigCommerce, our AI-based product data feed management platform, Feedonomics, and our brand and commerce site builder and visual editor, Makeswift. […] We have integrated all three products both operationally and commercially and have organized the teams around three offering groups, B2C, B2B, and Small Business.
p. 2 · Read in context →
Cloudflare, Inc. (NET)
A more peripheral but genuine competitor on two of GoDaddy's non-website legs: domain registration (Cloudflare is an ICANN-accredited registrar) and, more importantly, web and email security, DNS and website performance sold through a free-to-paid self-serve funnel that resembles GoDaddy's. The overlap is on domains, DNS and security rather than website building; exhibits are captioned to that scope.
Cloudflare's own map of the markets it competes in includes several that overlap GoDaddy's non-domains products — web security, domain name systems and email security — alongside many it does not (VPNs, DDoS, CDN). Read as the security/DNS edge of the overlap, not the website-building core.
The markets for our network and products are intensely competitive and characterized by rapid changes in technology, customer requirements, industry standards, and frequent introductions of new, and improvements of, existing products. Our broad portfolio of products exposes us to competition from a large number of competitors in a number of different markets, including companies and their product and services offerings in, among others, virtual private networks, internal and external firewalls, web security (including web application firewalls and content filtering), distributed denial-of-service (DDoS) prevention, intrusion detection and prevention, application delivery controls, content delivery networks, domain name systems, email security vendors, advanced threat prevention, and wide area network (WAN) technology.
p. 45 · Read in context →
Cloudflare's scale as a mass-market internet-infrastructure provider: millions of free and paying customers managing millions of Internet properties, with roughly 332,000 paying customers across 190+ countries — a self-serve base that overlaps GoDaddy on domains, DNS and security.
We view our millions of free and paying customers, which manage millions of Internet properties on our network, as part of a broad, global community. As of December 31, 2025, we had approximately 332,000 paying customers across more than 190 countries.
p. 21 · Read in context →
More peer documents
IONOS FY2024 Annual Report — market and competitor landscape (pp.96–98) — FY2024 AR · 173 pages · Prior-year description of the web-presence market and named domain competitors (united domains, InterNetX), useful for tracking how IONOS frames the field over time. · Open →
Source: S&P Capital IQ consensus via Xpressfeed · Generated 2026-07-28.
FY2028 normalized EPS marked up ~7% in 90 days while revenue holds flat
The lift is recent: over the prior six months both revenue lines and FY2027 EPS were trimmed 2–3%, so the 90-day EPS upgrade reads as a partial recovery rather than a fresh upcycle.
Currency: USD · Scale: money in millions, absolute · Point-in-time consensus; Δ90d is Now versus 90d.
| Metric | FY | 180d | 90d | 30d | Now | Δ90d |
|---|---|---|---|---|---|---|
| EPS (normalized) | FY2027 | $11.03 | $10.59 | $10.77 | $10.77 | +1.8% |
| EPS (normalized) | FY2028 | — | $10.52 | $11.22 | $11.22 | +6.7% |
| Revenue | FY2027 | $5.66bn | $5.55bn | $5.55bn | $5.55bn | +0.0% |
| Revenue | FY2028 | $6.07bn | $5.87bn | $5.88bn | $5.87bn | +0.1% |
Beat / miss record
Current sequences by metric: Revenue: 8 consecutive beats; EPS (normalized): 2 consecutive beats.
Currency: USD · Scale: money in millions, absolute · Consensus is captured before each actual first became effective.
| Quarter | Metric | Consensus | Actual | Surprise | Outcome |
|---|---|---|---|---|---|
| Q1 FY2026 | Revenue | $1.26bn | $1.27bn | +0.3% | Beat |
| Q1 FY2026 | EPS (normalized) | $1.99 | $2.05 | +2.7% | Beat |
| Q4 FY2025 | Revenue | $1.27bn | $1.27bn | +0.1% | Beat |
| Q4 FY2025 | EPS (normalized) | $2.22 | $2.30 | +3.7% | Beat |
| Q3 FY2025 | Revenue | $1.23bn | $1.27bn | +2.6% | Beat |
| Q3 FY2025 | EPS (normalized) | $2.15 | $1.99 | -7.1% | Miss |
| Q2 FY2025 | Revenue | $1.21bn | $1.22bn | +0.9% | Beat |
| Q2 FY2025 | EPS (normalized) | $1.89 | $1.90 | +0.4% | Beat |
| Q1 FY2025 | Revenue | $1.19bn | $1.19bn | +0.4% | Beat |
| Q1 FY2025 | EPS (normalized) | $1.97 | $1.86 | -5.2% | Miss |
| Q4 FY2024 | Revenue | $1.18bn | $1.19bn | +1.1% | Beat |
| Q4 FY2024 | EPS (normalized) | $1.73 | $1.97 | +13.8% | Beat |
| Q3 FY2024 | Revenue | $1.14bn | $1.15bn | +0.3% | Beat |
| Q3 FY2024 | EPS (normalized) | $1.40 | $1.80 | +27.9% | Beat |
| Q2 FY2024 | Revenue | $1.11bn | $1.12bn | +0.9% | Beat |
| Q2 FY2024 | EPS (normalized) | $1.28 | $1.43 | +11.4% | Beat |
Revenue compounds ~6% a year with EBITDA and free cash flow modeled to grow faster
Currency: USD · Scale: money in millions, absolute · YoY uses the prior fiscal year from the feed; analyst count and range use the first displayed period.
| Metric | FY2026E | FY2027E | FY2028E | YoY | Analysts | Low / high |
|---|---|---|---|---|---|---|
| Revenue | $5.24bn | $5.55bn | $5.87bn | +5.9% | 17 | $5.20bn / $5.26bn |
| EBITDA | $1.75bn | $1.89bn | $2.09bn | +10.3% | 14 | $1.73bn / $1.77bn |
| Free cash flow | $1.80bn | $1.95bn | $2.15bn | +7.8% | — | — |
Outer-year GAAP EPS is contested: FY2028 spans $9.02 to $13.28
Coverage falls from 13 analysts on FY2027 to 8 on FY2028, so the wider FY2028 band partly reflects thinner participation rather than pure conviction spread.
Currency: USD · Scale: money in millions, absolute · Spread/mean is absolute high-low divided by absolute mean.
| Metric | Period | Mean | Low–high | Spread/mean | Analysts |
|---|---|---|---|---|---|
| EPS (GAAP) | FY2027E | $8.97 | $7.49–$10.75 | 36.3% | 13 |
| EPS (GAAP) | FY2028E | $10.93 | $9.02–$13.28 | 38.9% | 8 |
Street split buy-to-hold with no sells; targets span $83–$190, median $100
The mean target sits above the median, lifted by the lone $190 high; nine buy-side ratings face eight holds.
Currency: USD · Scale: money in millions, absolute · Analyst counts shown explicitly.
| Street view | Reading | Analysts |
|---|---|---|
| Recommendation mix | Buy 7, Outperform 2, Hold 8, Underperform 0, Sell 0 | 17 |
| Consensus score | 2.06 | 17 |
| Target price | mean $111.9; median $100.0; high $190.0; low $83.00 | 15 |
Normalized-EPS and FY2029 consensus rest on very few analysts
Annual normalized-EPS consensus draws on just 1–3 analysts and FY2029 revenue/EBITDA on 1–2, so treat the outer-year EPS levels and momentum as indicative. GAAP EPS, with 8–13 estimates, is far better covered.
Visible Alpha broker models via S&P Xpressfeed · 13 brokers · 385 line items · freshest revision 2026-07-18.
Thirteen brokers model GoDaddy as a cash-compounding platform where Applications & Commerce, not the mature domains-and-hosting Core platform, drives the top line and, increasingly, the profit. The consensus growth story is monetization: rising revenue and bookings per customer against a roughly flat customer base. Brokers largely agree on revenue but diverge on how much of it reaches EPS and free cash flow.
Applications & Commerce is the growth engine — +12% in FY-2026 vs Core platform's +2.5%
Core platform — chiefly domains and hosting — is modeled as a low-single-digit annuity; Applications & Commerce carries the top line and steadily gains share of the mix. Gross bookings, the forward-billings gauge, is modeled to outpace revenue.
| Line | FY-2025A | FY-2026E | FY-2027E | FY-2028E | YoY | Brokers |
|---|---|---|---|---|---|---|
| Revenue | — | — | — | — | — | — |
| Total revenue | $4.95bn | $5.24bn | $5.54bn | $5.87bn | +6.0% | 13 |
| Revenue - Applications & Commerce | $1.89bn | $2.11bn | $2.33bn | $2.58bn | +11.7% | 13 |
| Revenue - Core platform | $3.06bn | $3.13bn | $3.21bn | $3.30bn | +2.5% | 13 |
| Bookings | — | — | — | — | — | — |
| Gross bookings | $5.43bn | $5.69bn | $6.04bn | $6.44bn | +4.9% | 11 |
Growth is monetization, not customers — ARPU climbs to $259 while the base stays roughly flat
Average customers are modeled essentially flat; net additions swing from negative in FY-2025 to positive thereafter, so nearly all growth is price and attach rather than new logos.
| Line | FY-2025A | FY-2026E | FY-2027E | FY-2028E | YoY | Brokers |
|---|---|---|---|---|---|---|
| Unit economics | — | — | — | — | — | — |
| Average customers(M#) | 20.49m Number | 20.47m Number | 20.56m Number | 20.65m Number | -0.1% | 10 |
| Average revenue per customer($) | $241.5 | $259.0 | $269.8 | $285.5 | +7.3% | 10 |
| Bookings per customer($) | $265.1 | $277.8 | $293.6 | $311.8 | +4.8% | 10 |
| Net customer additions(M#) | -51,769 Number | 80,458 Number | 97,811 Number | 140,951 Number | +255.4% | 10 |
Margins bend up as Applications & Commerce overtakes Core platform as the profit engine by FY-2028
Normalized EBITDA is modeled expanding faster than revenue; A&C segment EBITDA, below Core platform's today, is modeled to pass it as the higher-margin segment scales. The segment splits rest on 5-7 brokers.
| Line | FY-2025A | FY-2026E | FY-2027E | FY-2028E | YoY | Brokers |
|---|---|---|---|---|---|---|
| Profit | — | — | — | — | — | — |
| Normalized EBITDA | $1.57bn | $1.75bn | $1.89bn | $2.06bn | +11.3% | 13 |
| Normalized EBITDA - Application & Commerce | $856.05m | $978.65m | $1.10bn | $1.23bn | +14.3% | 7 |
| Normalized EBITDA - Core platform | $998.17m | $1.06bn | $1.09bn | $1.15bn | +5.7% | 7 |
| Cash | — | — | — | — | — | — |
| Free cash flow | $1.59bn | $1.81bn | $1.93bn | $2.02bn | +13.9% | 12 |
Brokers agree on revenue but split on earnings and cash
Revenue estimates are tightly clustered, yet FY-2028 diluted EPS spans $8.14 to $11.49 — the split is over margin capture and buyback pace, not demand.
| Line | Period | Median | Q1–Q3 | Min–max | Brokers |
|---|---|---|---|---|---|
| EPS attributable to GoDaddy Inc. - Diluted($) | FY-2027E | $8.84 | $7.94–$9.18 | $7.49–$9.60 | 13 |
| EPS attributable to GoDaddy Inc. - Diluted($) | FY-2028E | $10.08 | $9.18–$10.89 | $8.14–$11.49 | 10 |
| Operating income/(loss) | FY-2028E | $1.62bn | $1.54bn–$1.71bn | $1.46bn–$1.73bn | 10 |
| Free cash flow | FY-2028E | $2.05bn | $1.99bn–$2.10bn | $1.81bn–$2.12bn | 9 |
Coverage thins in the out-years and on segment detail
Headline lines carry 11-13 brokers, but FY-2028 coverage drops toward 9-10, segment EBITDA rests on 5-7, and ARR and net revenue retention on just 2-3 — treat those as a few analysts' views, not consensus.
Headline P&L consensus, momentum and beat/miss live in the CapIQ tab.
Source: S&P Capital IQ transcripts via Xpressfeed · latest indexed call 2026-04-30 · generated 2026-07-28.
Latest call digest
GoDaddy Inc., Q1 2026 Earnings Call, Apr 30, 2026 · 2026-04-30T21:00:00
Q1 2026 call — April 30, 2026. The prepared remarks were an AI story wrapped around a steady financial one: revenue grew 6% to $1.3 billion, normalized EBITDA margin expanded over 200 basis points to 33%, free cash flow rose 15% to $474 million (trailing-12-month $1.68 billion), and share count fell to 133 million. Management framed its AI transformation around three proof points — the new Airo AI Builder, which reached a "$10 million plus in annualized bookings run rate within weeks of its beta launch"; Agent Name Service (ANS), where non-GoDaddy agents now "number in the thousands"; and AI-driven internal efficiency, including Airo Care lifting first-test resolution rates by roughly 50%. ARPU rose 9% to $246 with retention above 85%.
The Q&A reality was more guarded. Total bookings grew only 3% — described as the "peak impact" of the promotional offer, the .CO registry expiration and a tough aftermarket compare — and management reaffirmed that bookings and revenue growth should be "at or above parity" for the rest of the year. FY2026 revenue guidance ($5.195–$5.275 billion) and the ~$1.8 billion free cash flow target were reaffirmed. Analysts pushed hardest on Airo AI Builder economics, which management declined to break out as "too early," and on capital allocation, where Q1 buybacks ($280 million) ran below free cash flow; that question was deflected to "look at our history." Management also reiterated it will let low-LTV domain customers go in favor of high-intent ones.
Participant coverage from the latest call.
| Group | Participants | Count |
|---|---|---|
| Management | Christie Masoner — Vice President & Head of Investor Relations, GoDaddy Inc.; Amanpal Bhutani — CEO & Director, GoDaddy Inc.; Mark McCaffrey — Chief Financial Officer, GoDaddy Inc. | 3 |
| Analysts | Vikram Kesavabhotla — Senior Research Analyst, Robert W. Baird & Co. Incorporated, Research Division; Hoi-Fung Wong — MD & Senior Analyst, Oppenheimer & Co. Inc., Research Division; Trevor Young — Former Vice President, Barclays Bank PLC, Research Division; Mark Zgutowicz — Senior Equity Analyst, The Benchmark Company, LLC, Research Division; Willow Miller — Research Analyst, William Blair & Company L.L.C., Research Division; Sang-Jin Byun — Equity Analyst, Jefferies LLC, Research Division; Eleanor Smith — Analyst, JPMorgan Chase & Co, Research Division; Naved Khan — Managing Director of Internet Equity Research, B. Riley Securities, Inc., Research Division; John Halpert — Research Analyst, Cantor Fitzgerald & Co., Research Division; Kishan Patel — Senior Research Associate, Raymond James & Associates, Inc., Research Division; Kathleen Alexis Keyser — Research Associate, Morgan Stanley, Research Division | 11 |
Curated latest-call exchanges; one row per analyst topic.
| Analyst | Firm | Topic | What changed in Q&A |
|---|---|---|---|
| Vikram Kesavabhotla | Baird | Customer quality and AI-efficiency reinvestment | Asked how GoDaddy ensures it attracts the right customer and how AI savings flow to EBITDA versus reinvestment; management defined quality via activation and second-product attach, and described a disciplined, ROI-gated approach to funding AI marketing. |
| Ken Wong | Oppenheimer | Airo AI Builder ceiling and hosting for AI workloads | Pressed on how large the Builder could become; management declined to size it as very early, and confirmed the Builder runs on GoDaddy hosting while staying focused on micro-business, not enterprise, workloads. |
| Trevor Young | Barclays | Bookings shape and capital allocation / M&A | Asked about the bookings curve and why buybacks trailed free cash flow with cash building; management guided parity or better and deflected the buyback-pace question to its track record, offering no specific M&A signal. |
| Mark Zgutowicz | Benchmark | Airo AI Builder unit economics | Sought transaction size, credit-versus-subscription mix and margin profile; management declined specifics, saying it is too early and reiterating only that the product is gross-margin positive. |
| Eleanor Smith | JPMorgan | ANS right-to-win and domain share strategy | Questioned GoDaddy's advantage in ANS versus larger competitors and whether it would sacrifice domain share; management leaned on its DNS and largest-registrar position and confirmed willingness to let low-LTV domain customers go. |
| John Halpert | Cantor Fitzgerald | The removed lower-value product | Asked which product was retired and its impact; management did not name it, describing it as an older offering with little-to-no bookings impact and a slight churn benefit. |
| Kishan Patel | Raymond James | AI-native discovery and top-of-funnel traffic | Asked whether AI interfaces are changing acquisition patterns; management said the prior search-traffic impact from AI mode continued but was offset by conversion, and positioned GoDaddy to serve agent- and API-led journeys. |
Theme tracker
Themes are curator-classified across supplied calls.
| Theme | Status | Quarters mentioned | Read-through |
|---|---|---|---|
| AI / Airo transformation | persisted | Q3 2024, Q4 2024, Q1 2025, Q2 2025, Q3 2025, Q4 2025, Q1 2026 | The dominant narrative on every recent call, evolving from generative Airo (discovery/engagement/monetization) to an agentic Airo.ai and, most recently, the Airo AI Builder with early bookings. The framing has shifted from a longer-dated experiment toward a product management is willing to fund with paid marketing. |
| Agent Name Service (ANS) | emerged | Q3 2025, Q4 2025, Q1 2026 | A new identity-layer narrative introduced in Q3 2025 that ties domains/DNS to agent identity. It has progressed from concept to a MuleSoft integration to thousands of non-GoDaddy agents, but remains pre-revenue and dependent on open-standard adoption. |
| High-intent customers and $500-plus cohort / ARPU | persisted | Q3 2024, Q4 2024, Q1 2025, Q2 2025, Q3 2025, Q4 2025, Q1 2026 | A consistent strategic frame: management deprioritizes headline customer count in favor of high-intent customers, rising attach, near-perfect retention and ARPU growth. The $500-plus cohort has been cited at roughly 9–10% of the base across the last several calls. |
| Pricing and bundling | persisted | Q3 2024, Q4 2024, Q1 2025, Q2 2025, Q3 2025, Q4 2025, Q1 2026 | A headline growth driver through 2024 and mid-2025 that has recently been deferred: by Q4 2025 management said pricing initiatives would "have to wait" behind the AI-based Websites + Marketing rebuild, and Q1 2026 reiterated that pricing changes wait until the new product reaches parity. |
| Free cash flow North Star and margin expansion | persisted | Q3 2024, Q4 2024, Q1 2025, Q2 2025, Q3 2025, Q4 2025, Q1 2026 | The financial backbone of every call: a stated 20% free-cash-flow CAGR North Star, roughly 1:1 EBITDA-to-FCF conversion and steady margin expansion toward the 33% 2026 target, which management now expects to exceed. |
| Commerce / GPV updates | dropped | Q3 2024, Q4 2024, Q1 2025, Q2 2025, Q3 2025 | Quarterly commerce and gross-payments-volume updates (GoDaddy Capital, Rate Saver, GPV milestones) were a staple of prepared remarks through mid-2025, but faded out of the AI-dominated Q4 2025 and Q1 2026 calls, where commerce appears mainly as one leg of the identity/presence/commerce platform rather than a discussed growth initiative. |
Guidance ledger
Quotes, calls, and speakers are source-verified; outcomes are curator-classified.
| Verbatim guidance | Call | Speaker | Curator outcome | Outcome note |
|---|---|---|---|---|
| “we are also raising our unlevered free cash flow target to $1.475 billion-plus and free cash flow to $1.325 billion-plus for the full year” | GoDaddy Inc., Q3 2024 Earnings Call, Oct 30, 2024 · 2024-10-30T21:00:00 | Mark McCaffrey | kept | FY2024 free cash flow grew 25% to $1.4 billion, above this raised target. |
| “For the full year of 2025, we are targeting free cash flow of at least $1.5 billion, representing growth of over 11%.” | GoDaddy Inc., Q4 2024 Earnings Call, Feb 13, 2025 · 2025-02-13T22:00:00 | Mark McCaffrey | kept | The target was raised through 2025 and FY2025 free cash flow reached $1.6 billion, up 19%. |
| “In 2025, we expect normalized EBITDA margin expansion of approximately 100 basis points, and we remain on track to deliver our Investor Day target of 33% by 2026.” | GoDaddy Inc., Q4 2024 Earnings Call, Feb 13, 2025 · 2025-02-13T22:00:00 | Mark McCaffrey | kept | FY2025 delivered about 150 basis points of expansion to a 32% margin, ahead of the 100 bps target; the 33% 2026 target remains pending. |
| “we are raising our full year free cash flow target to approximately $1.6 billion, representing growth of over 18%” | GoDaddy Inc., Q2 2025 Earnings Call, Aug 07, 2025 · 2025-08-07T21:00:00 | Mark McCaffrey | kept | FY2025 free cash flow came in at $1.6 billion, up 19%, per the Q4 2025 call. |
| “we are raising our 2025 revenue guide to a range of $4.93 billion to $4.95 billion, representing growth of approximately 8% at the midpoint” | GoDaddy Inc., Q3 2025 Earnings Call, Oct 30, 2025 · 2025-10-30T21:00:00 | Mark McCaffrey | kept | FY2025 revenue came in at approximately $5 billion, 8% growth, per the Q4 2025 call. |
| “we expect total revenue to be within a range of $5.195 billion to $5.275 billion, representing growth of approximately 6% at the midpoint” | GoDaddy Inc., Q4 2025 Earnings Call, Feb 24, 2026 · 2026-02-24T22:00:00 | Mark McCaffrey | pending | FY2026 guidance, reaffirmed on the Q1 2026 call; the year is not yet complete. |
| “we reaffirm our full year free cash flow target of approximately $1.8 billion” | GoDaddy Inc., Q1 2026 Earnings Call, Apr 30, 2026 · 2026-04-30T21:00:00 | Mark McCaffrey | pending | FY2026 free cash flow target; management also reiterated it is on track to exceed its 20% North Star CAGR. |
Q&A pressure map
Question counts and firms are curator tallies; analyst coverage shown above.
| Topic | Questions | Firms | Pressure / response |
|---|---|---|---|
| Airo AI Builder economics, scale and monetization | 5 | Oppenheimer, Benchmark, Jefferies, B. Riley, William Blair | The most pressed topic on the Q1 2026 call. Several firms sought unit economics, credit-versus-subscription mix, margin profile and how large the product could become; management repeatedly answered that it is too early, offering only the $10 million annualized run rate and a gross-margin-positive assurance — a mild non-answer to the specific unit-economics asks. |
| Bookings-to-revenue parity and shape of the recovery | 4 | Baird, Oppenheimer, Barclays, B. Riley | Recurring since Q4 2025, when the .com promotional offer and term-mix shift cut bookings. Analysts probed whether the drag is one-time and how bookings re-accelerate; management consistently guides to parity or better by year-end, with Q1 2026 framed as the peak impact. |
| ANS competitive right-to-win | 3 | JPMorgan, Oppenheimer, Citi | Across Q3 2025 through Q1 2026, analysts repeatedly asked why GoDaddy can win in agent identity versus larger players. Management leans on its DNS infrastructure and largest-registrar position; it has not attached revenue to ANS, so the payoff remains a conviction case. |
| AI competition and search traffic at the top of funnel | 3 | Oppenheimer, William Blair, Raymond James | Analysts pressed on vibe-coding entrants and AI-mode search eroding the funnel. Management concedes some search-traffic impact but says it is offset by conversion and that it has not seen large direct funnel impact — a measured rather than dismissive answer. |
Language shifts
Only language evidence verified against the referenced component is shown.
| Observation | Verbatim evidence | Call ID | Component |
|---|---|---|---|
| First explicit admission of a self-inflicted near-term bookings and revenue headwind, a more cautious note than the prior string of beat-and-raise quarters. | “But the demand for this offer was greater than we expected. And the shift in term mix, combined with the promotional price reduced up-front bookings and near-term revenue.” | 1982561971 | 1 |
| New hedging vocabulary on competition: management acknowledges it is not immune to AI entrants while asserting limited funnel impact, a shift from its earlier unqualified bullishness on AI. | “I'm not suggesting that we are immune to what's happening in the world, we just have not seen very large impact of that in our funnel yet or at this time.” | 1982561971 | 49 |
| Persistent acknowledgment of an AI-driven search headwind, consistently framed as offset by conversion rather than as a growth risk. | “we do see some impact to traffic in search because of the move to AI mode, but we were able to offset that impacted traffic by improving conversion on our side” | 1993783748 | 56 |
| Escalating confidence language on internal AI code generation, moving from a "70% by year-end" goal earlier in 2025 to "the majority" of code and "breathtaking velocity." | “AI tools are now generating the majority of our code. New code bases are almost entirely AI-generated, shipping new features at breathtaking velocity” | 1982561971 | 1 |
The call history shows a company mid-pivot: a durable, cash-generative domains-plus-A&C engine, executing consistently on margin and free cash flow, is now funding an unproven AI bet in Airo AI Builder and ANS while a deliberate promotional and term-mix change plus the .CO loss temporarily depress bookings. The financial discipline is well established, but the AI revenue thesis is early and unquantified, and management's repeated reluctance to size it is the central gap for the current debate.